

P&L Currency Analysis
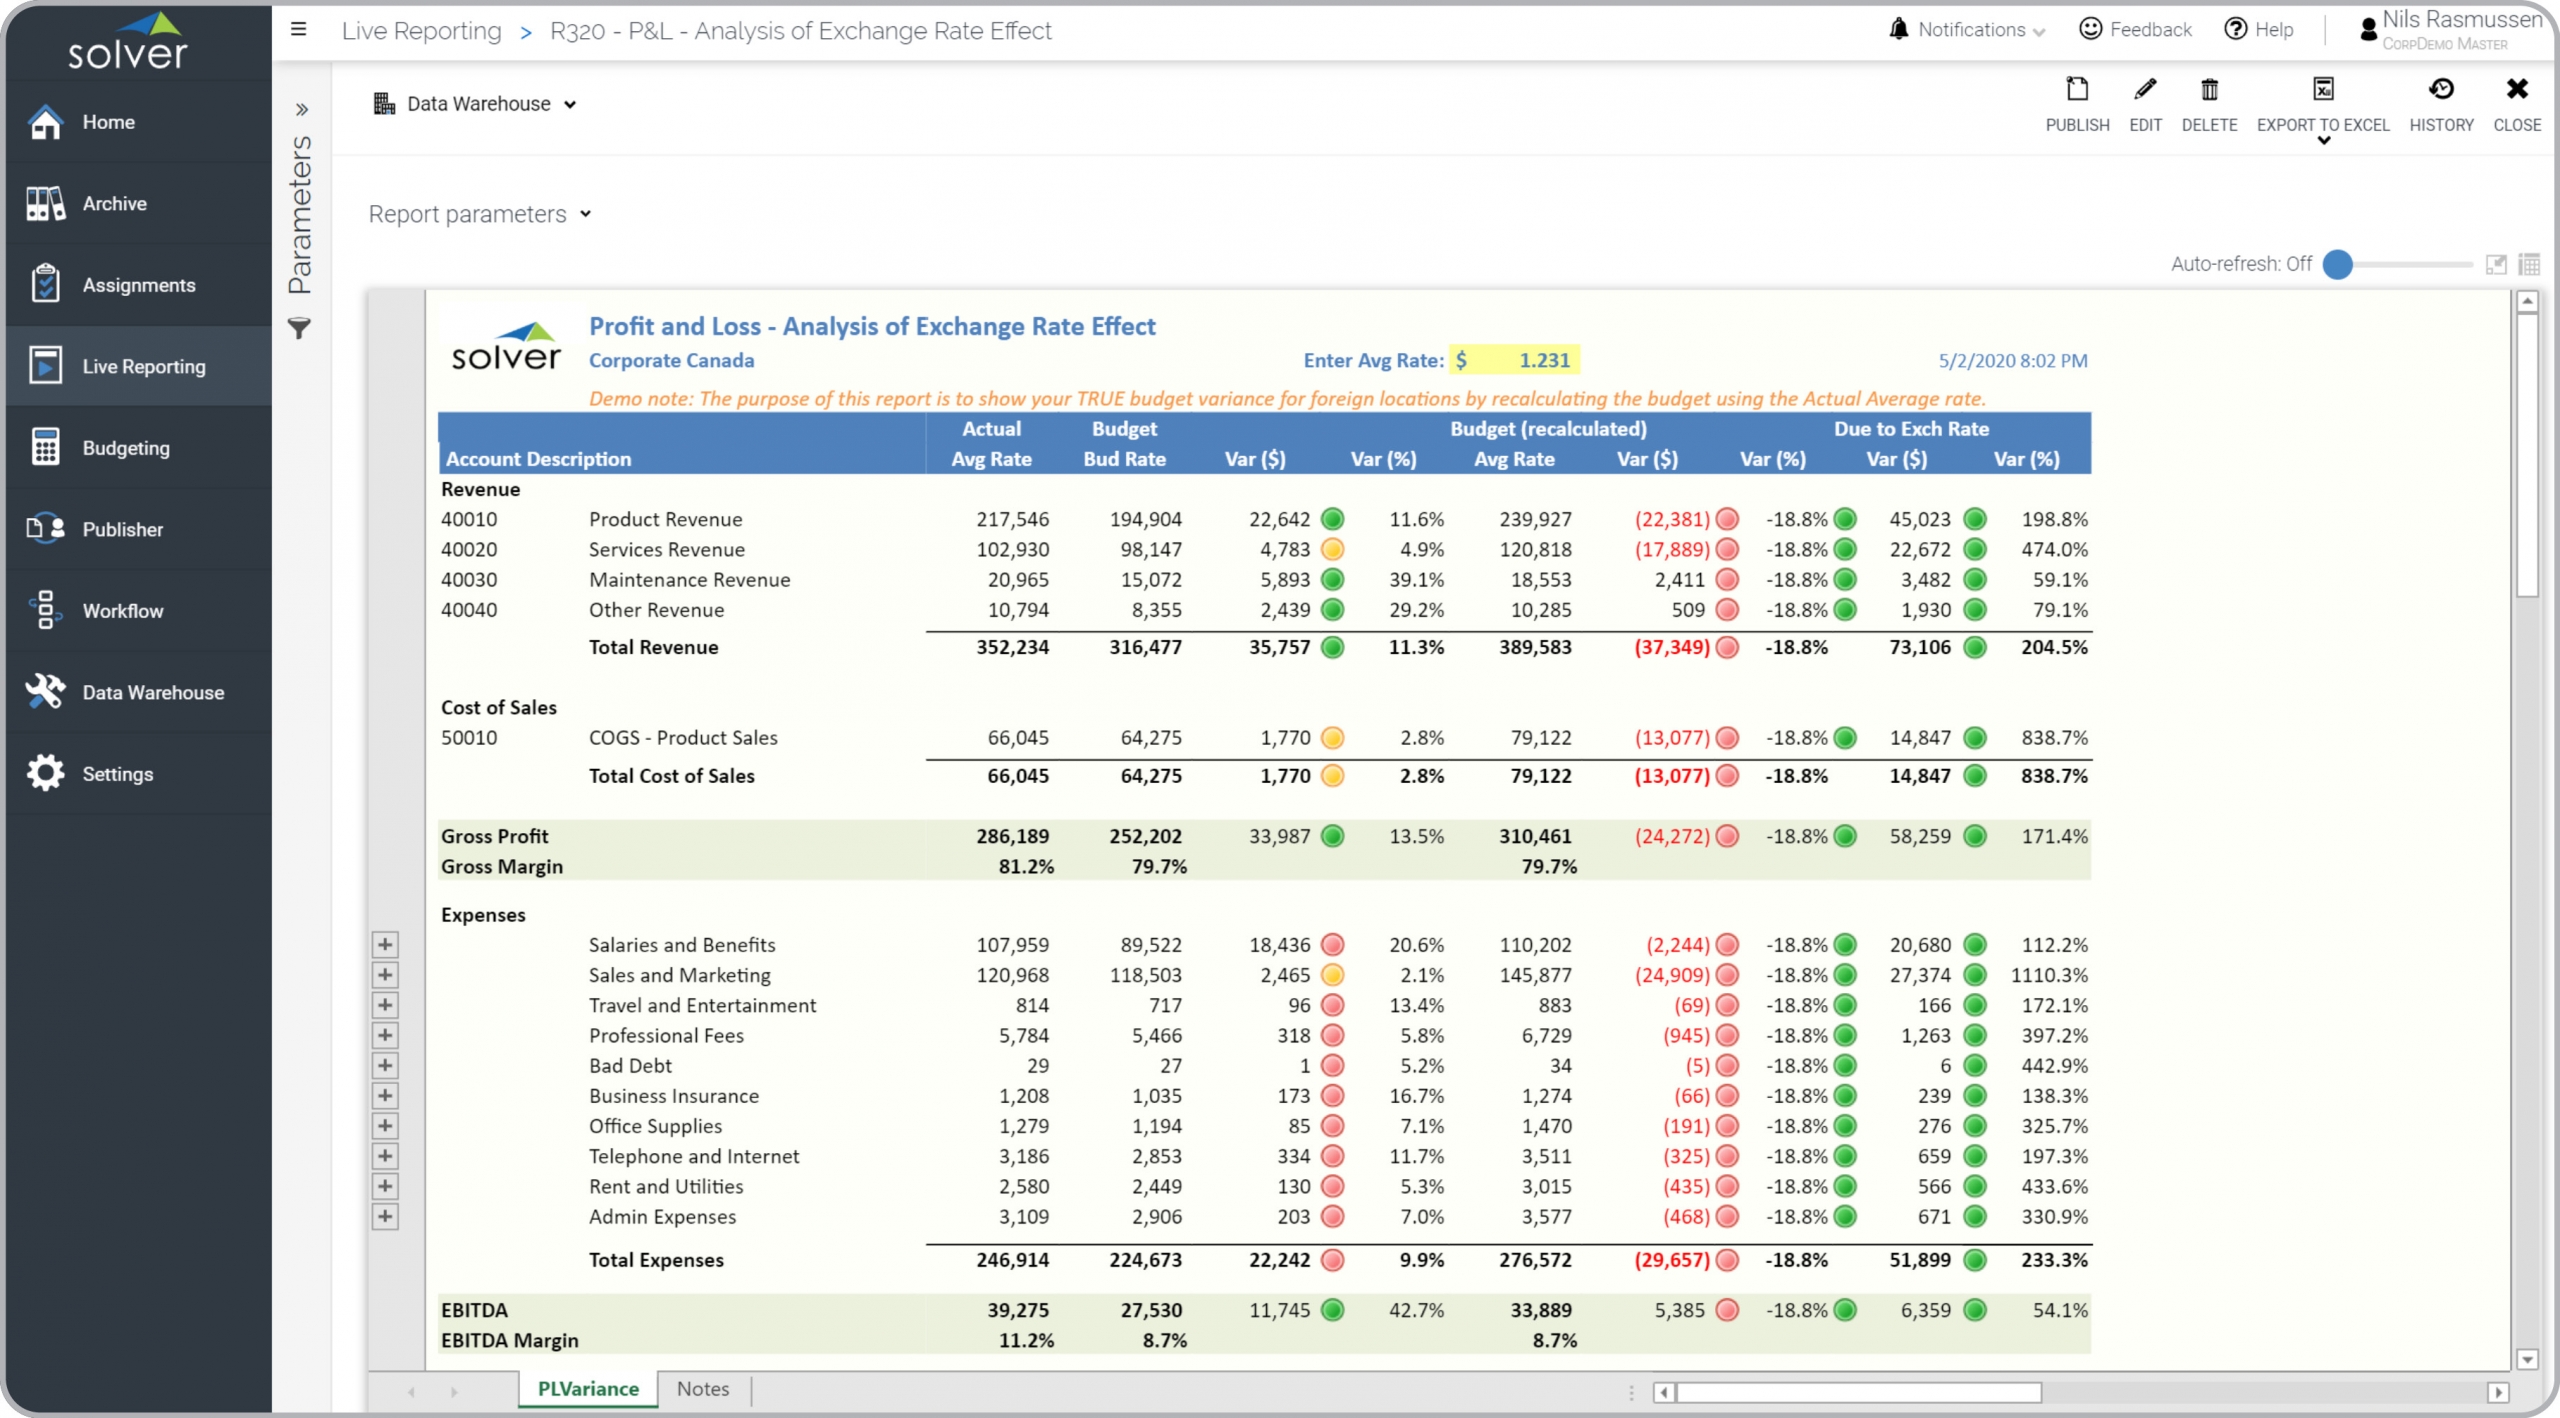
What is a Profit & Loss Report with Exchange Rate Analysis? Profit & Loss Currency Reports are considered month end consolidation tools and are used by CFOs and Group Managers to determine the impact of actual versus budget exchange rates on results. A key functionality in this type of financial report automatically re-calculates the Budget to use the same rate as the Actual data. Managers can directly compare the regular budget variance (at the budget rate) with the recalculated budget (at the actual rate). Managers can then see how much of their actual to budget variance was purely because of differences in exchange rates, and how much was actually due to the company's performance. You will find an example of this type of financial report below.
Purpose of Profit & Loss Currency Analysis Reports Companies and organizations use Profit & Loss Currency Analysis Reports to easily determine true subsidiary performance versus good (or bad) luck with actual versus budget exchange rates. When used as part of good business practices in a Finance & Accounting Department, a company can improve its ability to see true performance issues versus results caused by external forces such as exchange rates. A company can also reduce the risk that important problems go undetected.
Who Uses This Type of Financial Report? The typical users of this type of financial report are: CFOs and Group Managers. Other Financial Reports Often Used in Conjunction with Profit & Loss Currency Analysis Reports Progressive Finance & Accounting Departments sometimes use several different Profit & Loss Currency Analysis Reports, along with balance sheets, cash flow reports and other management and control tools.
Where Does the Data for Analysis Originate From? The Actual (historical transactions) data typically comes from enterprise resource planning (ERP) systems like: Microsoft Dynamics 365 (D365) Finance, Microsoft Dynamics 365 Business Central (D365 BC), Microsoft Dynamics AX, Microsoft Dynamics NAV, Microsoft Dynamics GP, Microsoft Dynamics SL, Sage Intacct, Sage 100, Sage 300, Sage 500, Sage X3, SAP Business One, SAP ByDesign, Acumatica, Netsuite and others. In analyses where budgets or forecasts are used, the planning data most often originates from in-house Excel spreadsheet models or from professional xFP&A solutions.
This Solver report template connects directly to your ERP data via the Solver Data Warehouse, enabling near real-time analysis with minimal setup. Designed for QuickStart deployment, it can be activated rapidly so your team can focus on analysis and decisions — not data preparation.
What is the P&L Currency Analysis in Solver? The P&L Currency Analysis is a pre-built xFP&A report template in Solver that delivers key financial and operational metrics in a single, easy-to-use interface, eliminating the need for manual data work or custom report development.
Who uses this Solver report template? CFOs, FP&A managers, and controllers use this report template to support month-end close, variance analysis, and management reporting. It is designed to be self-service and require no custom development.
Where does the data come from? Data is sourced automatically from your ERP system through the Solver Data Warehouse, which integrates with platforms such as Microsoft Dynamics 365 Business Central, Dynamics 365 Finance, Acumatica, Sage Intacct, and other leading ERP solutions. Once connected, the template updates in near real-time with no manual data entry required.
To learn more, visit the Resource Library.