

Bank – Product Report
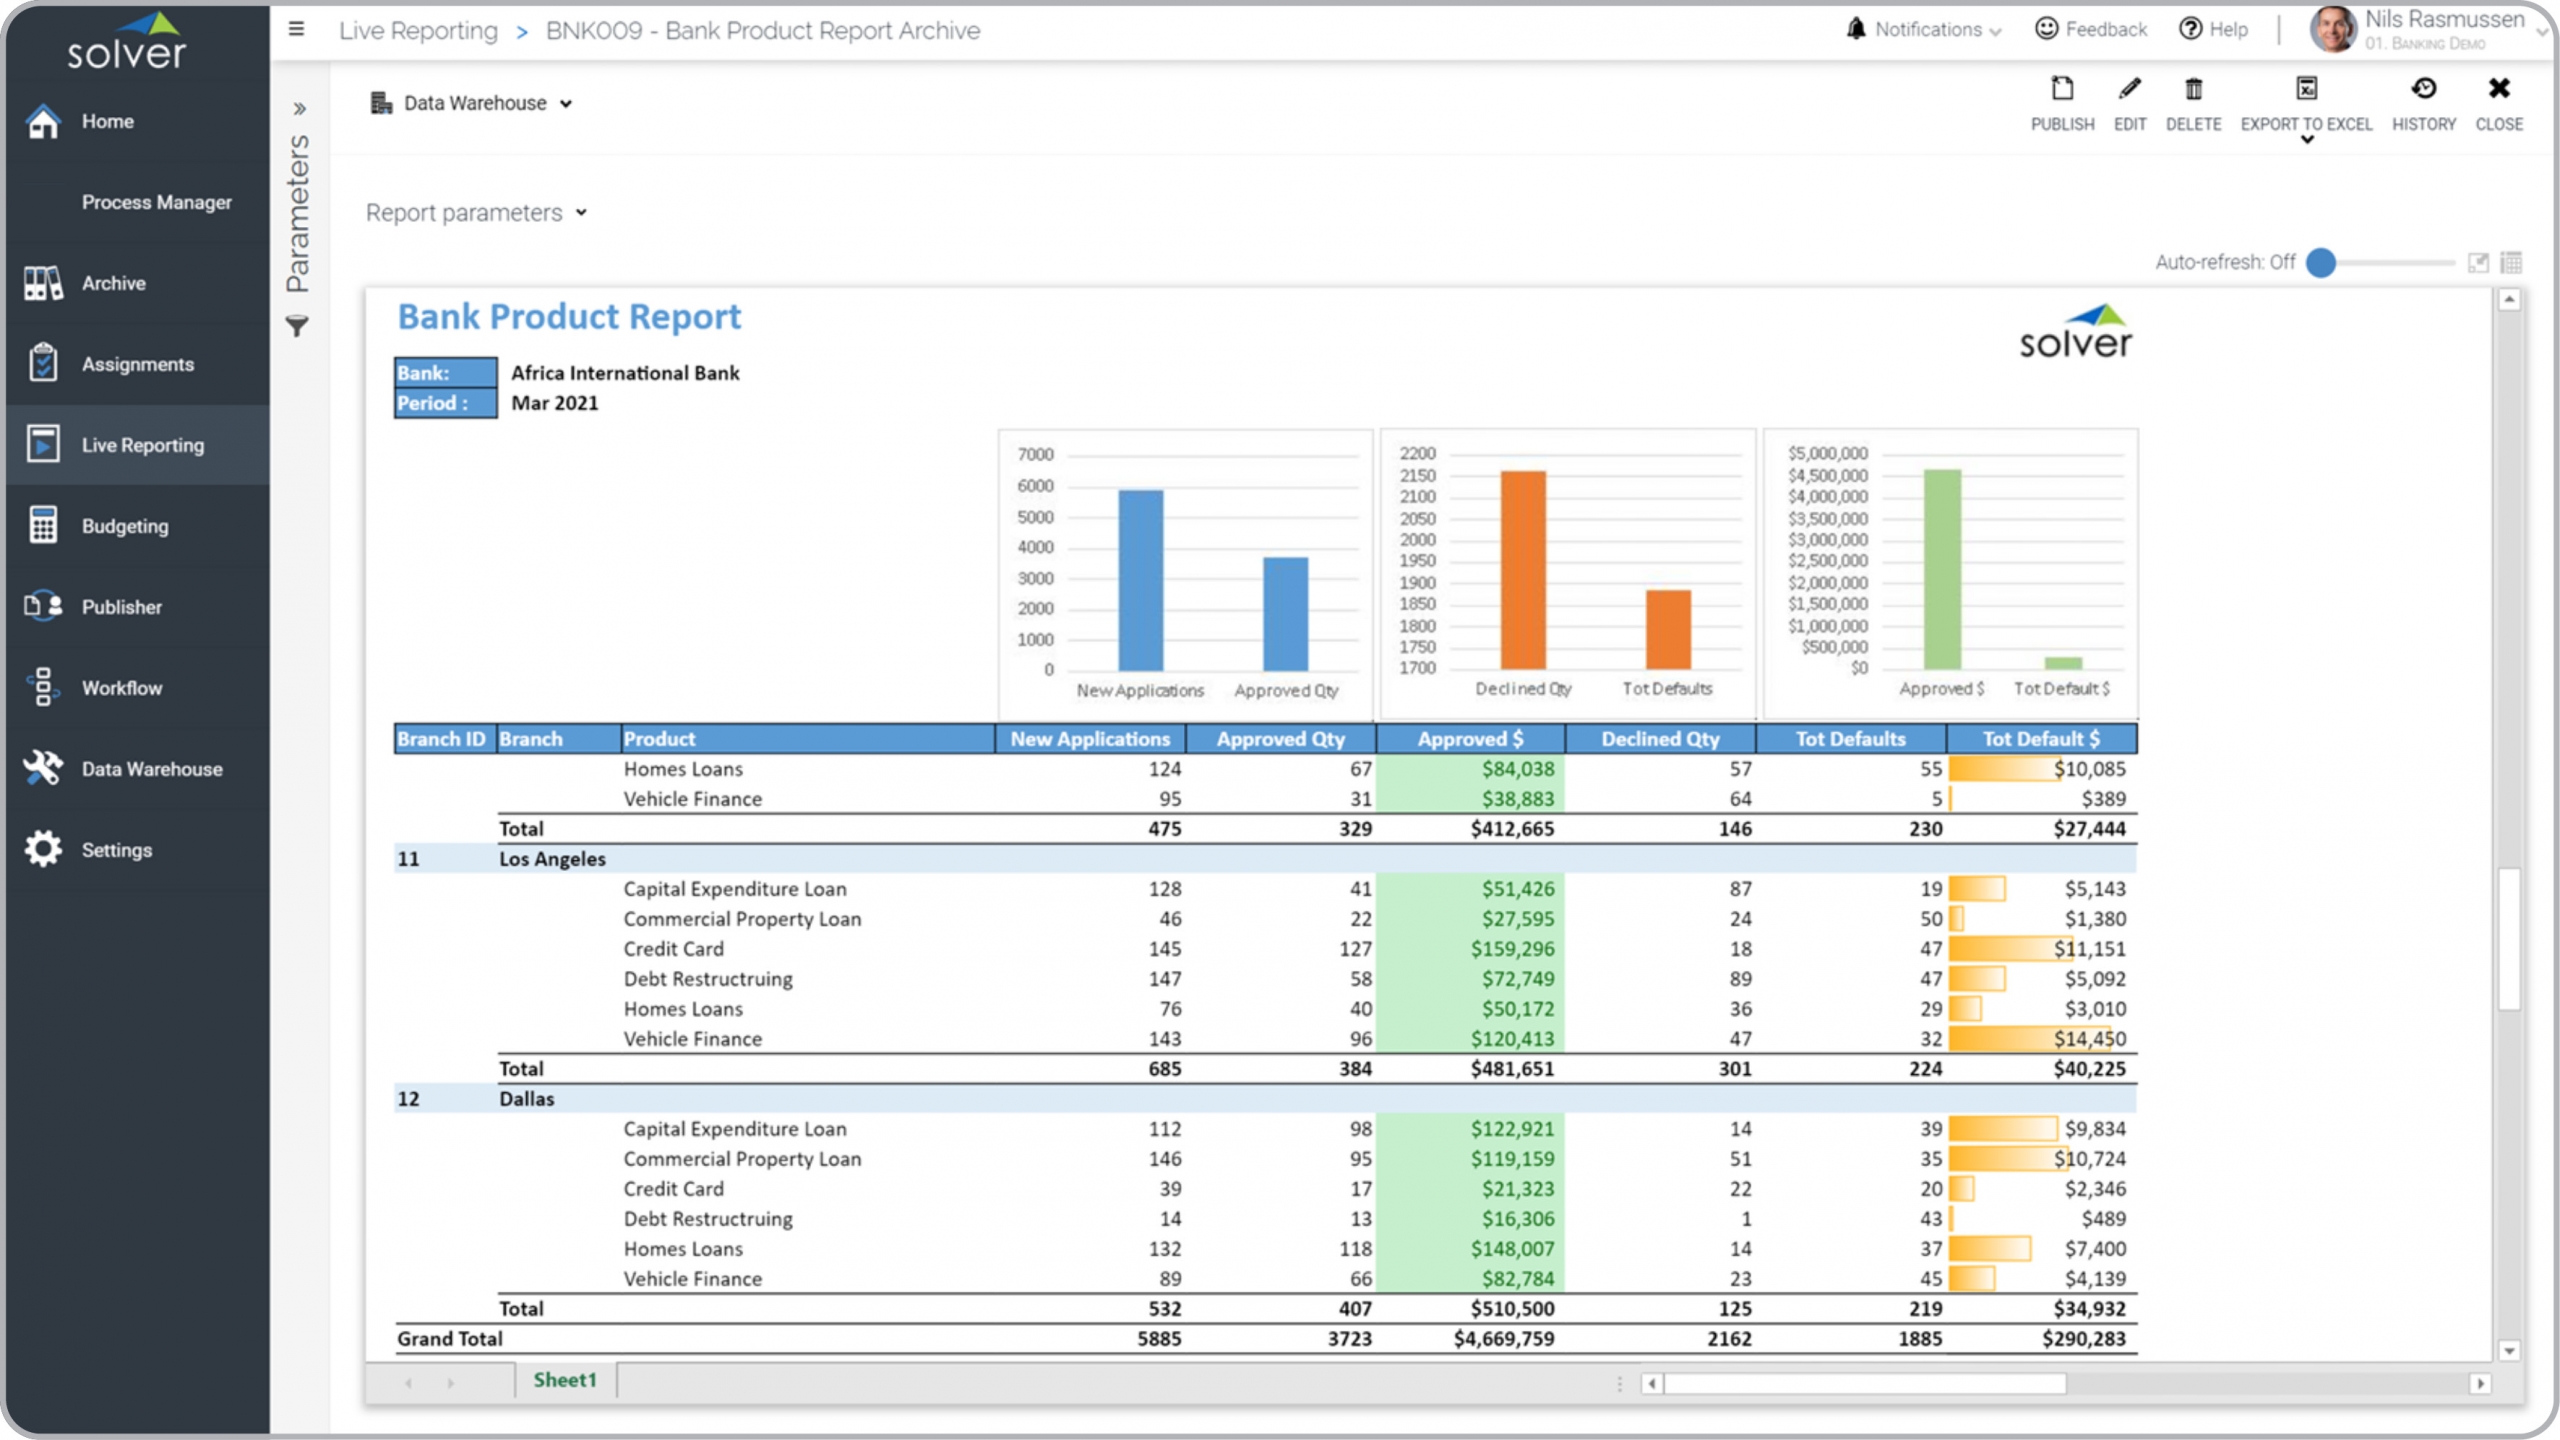
What is a Product KPI Report for Banks? Product KPI Reports are considered operational analysis tools and are used by executives and product managers to track key production metrics by product offering and branch. Some of the main functionality in this type of KPI report is that it can be filtered by any region and period, and it provides both detailed and summarized figures. The three charts on the top of the report show: 1) New and approved applications, 2) Declined applications and customer defaults, 3) Approved amount and default amount. The main body of the report contains the same six metrics as in the charts, and the rows show product figures by bank branch. You find an example of this type of KPI report below.
Purpose of Product Reports Banks use Product Reports to give leaders a detailed and summary view of pipeline and performance across product offerings and branches. When used as part of good business practices in Executive-, Loan- and Financial Planning & Analysis (FP&A) departments, a bank can improve its product strategies and profitability, and it can reduce the chances that decisions are being made without a near real-time picture of key product performance metrics.
Who Uses This Type of KPI report? The typical users of this type of KPI report are: Executives, Loan Managers, Product Managers, Analysts, Regional Managers, Branch Managers. Other Reports Often Used in Conjunction with Product Reports Progressive Executive-, Loan- and Financial Planning & Analysis (FP&A) departments sometimes use several different Product Reports, along with product dashboards, detailed and summary loan and credit card reports, profit & loss reports, balance sheets, cash flow statements, budget models, forecasts and other management and control tools.
Where Does the Data for Analysis Originate From? The Actual (historical transactions) data typically comes from enterprise resource planning (ERP) systems like: Microsoft Dynamics 365 (D365) Finance, Microsoft Dynamics 365 Business Central (D365 BC), Microsoft Dynamics AX, Microsoft Dynamics NAV, Microsoft Dynamics GP, Microsoft Dynamics SL, Sage Intacct, Sage 100, Sage 300, Sage 500, Sage X3, SAP Business One, SAP ByDesign, Acumatica, Netsuite and others. In analyses where budgets or forecasts are used, the planning data most often originates from in-house Excel spreadsheet models or from professional xFP&A solutions.
Built for banking finance teams and aligned with Solver's xFP&A platform, this Solver report template connects directly to your ERP data via the Solver Data Warehouse, enabling near real-time analysis with minimal setup. Designed for QuickStart deployment, it can be activated rapidly so your team can focus on analysis and decisions — not data preparation.
What is the Bank – Product Report in Solver? The Bank – Product Report is a pre-built xFP&A report template in Solver designed for banking organizations. It delivers key financial and operational metrics in a single, easy-to-use interface — purpose-built for banking finance workflows.
Who uses this Solver report template? Cfos, finance managers, and bank executives in banking organizations rely on this Solver report template to replace manual spreadsheet-based processes with automated, near real-time analysis. It is especially useful during month-end close, budget cycles, and board reporting.
Where does the data come from? Data is sourced automatically from your ERP system through the Solver Data Warehouse, which integrates with platforms such as Microsoft Dynamics 365 Business Central, Dynamics 365 Finance, Acumatica, Sage Intacct, and other leading ERP solutions. Core banking systems and loan management platforms are also supported as data sources. Once connected, the template updates in near real-time with no manual data entry required.
To learn more, visit the Resource Library.