

View Favorites
Retail – Product Dashboard
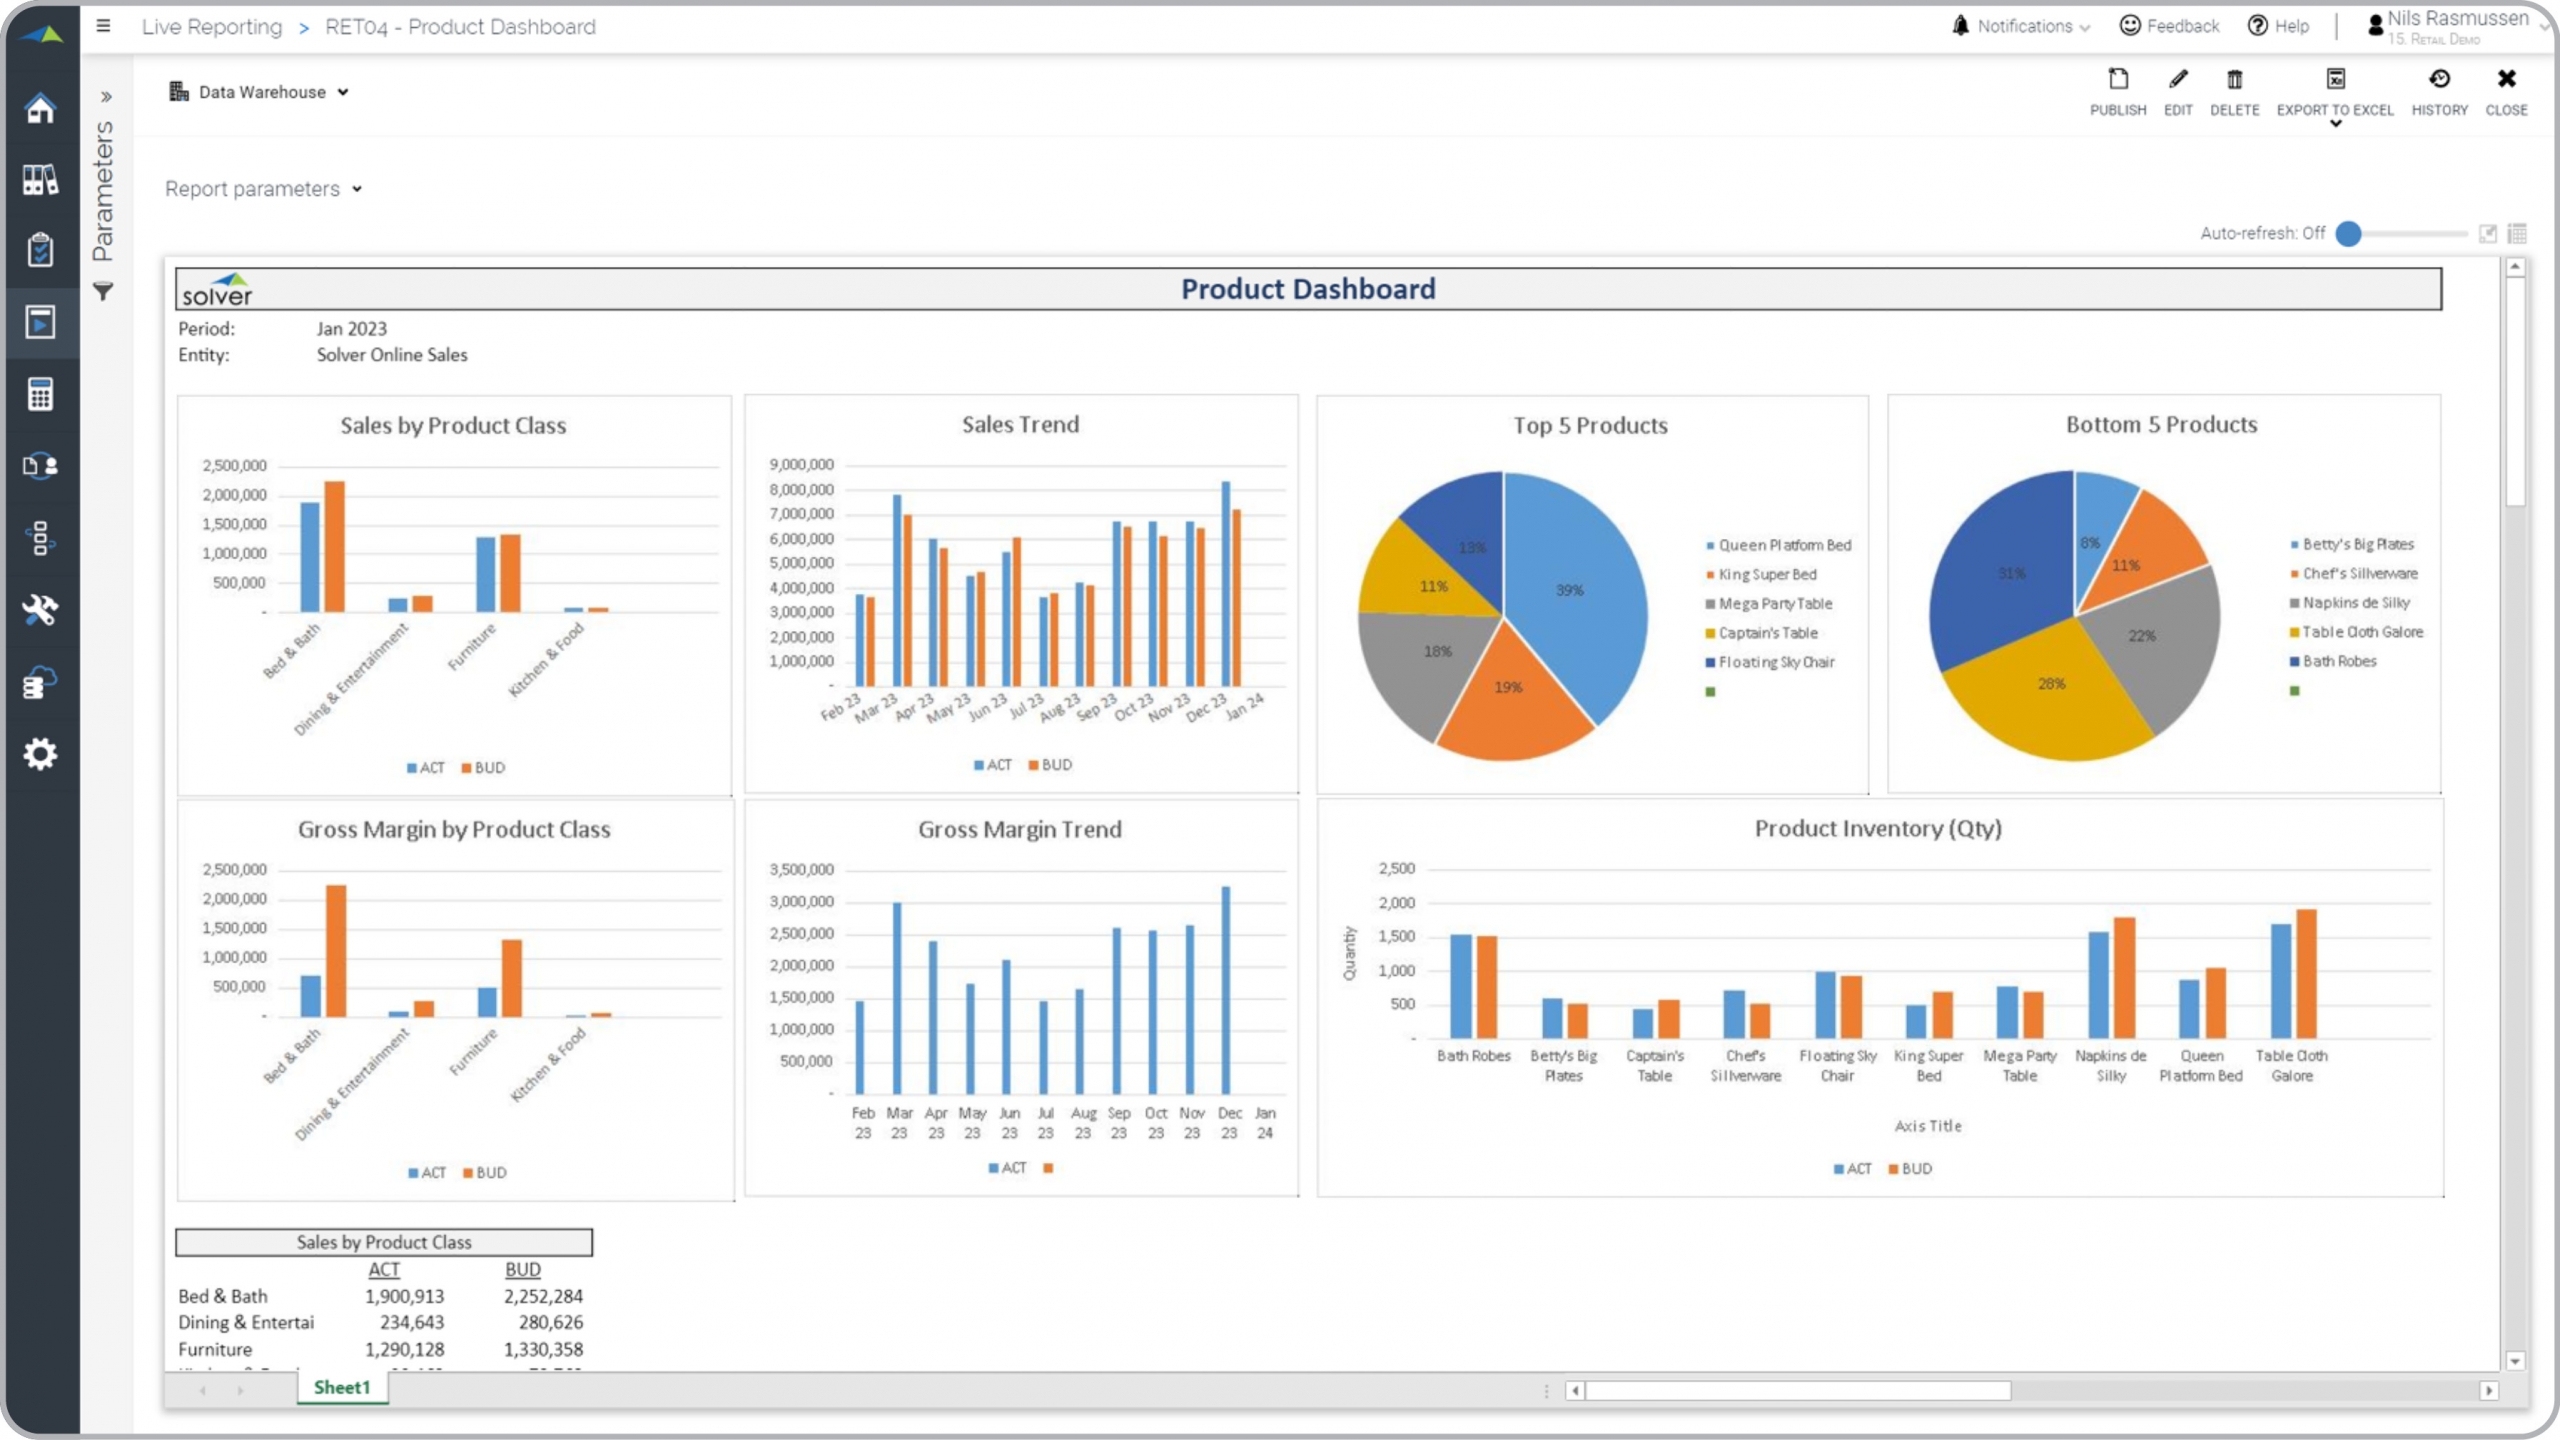
Shows graphical view of product KPIs like sales, gross margin, top performers and inventory.
What is a Product Dashboard for a Retail Company? Product dashboards are considered operational reports and are used by product managers and store managers to analyze trends and budget variances. Some of the main functionality in this type of dashboard is that it has seven different KPI charts. These include: Sales and gross margin by product class, monthly sales and gross margin trend, top and bottom products, and product inventory. You find an example of this type of dashboard below.
Purpose of Product Dashboards Retail businesses use Product Dashboards to provide managers with an easy, self-service solution to monitor product performance. When used as part of good business practices in retail operations, a company can improve its inventory, marketing and sales decisions as well as reduce the chances that to product performance goes under the radar for managers.
Who Uses This Type of Dashboard? The typical users of this type of dashboard are: Product managers, store and regional managers. Other Dashboards Often Used in Conjunction with Product Dashboards Progressive retail operations departments sometimes use several different Product Dashboards, along with general sales forecasts and budgets, sales dashboards, inventory reports, profit & loss reports and other management and control tools.
Where Does the Data for Analysis Originate From? The Actual (historical transactions) data typically comes from management systems or enterprise resource planning (ERP) systems like: Microsoft Dynamics 365 (D365) Finance, Microsoft Dynamics 365 Business Central (D365 BC), Microsoft Dynamics AX, Microsoft Dynamics NAV, Microsoft Dynamics GP, Microsoft Dynamics SL, Sage Intacct, Sage 100, Sage 300, Sage 500, Sage X3, SAP Business One, SAP ByDesign, Acumatica, Netsuite and others. In analyses where budgets or forecasts are used, the planning data most often originates from in-house Excel spreadsheet models or from professional xFP&A solutions.
To learn more, visit the Resource Library.
View Favorites