
Win Loss Analysis Report
This article describes the Pipeline Win Loss Dashboard that is included with Solver’s SaaS model for users of the Microsoft Dynamics 365 Business Central ERP and Binary Stream’s Subscription Billing Suite (SBS). It is part of a collection of ready-to-use reports, budget models and dashboard templates that Solver provides to SaaS companies as part of its cloud extended financial planning and analysis (xFP&A) solution.
Improving Decision-Making with Modern Pipeline Win Loss Dashboards for SaaS Companies
In today's competitive landscape, SaaS companies constantly seek ways to enhance their decision-making processes and gain deeper insights into their sales performance. One of the most valuable tools in their arsenal is the Pipeline Win Loss Dashboard, a pivotal component of xFP&A solutions like Solver. Let's delve into the transformative impact of modern Pipeline Win Loss Dashboards and how they can revolutionize the way SaaS companies analyze and optimize their sales strategies.
Challenges Without Automated Pipeline Win Loss Dashboards
- Manual Excel Spreadsheets: Traditional methods reliant on manual Excel spreadsheets create inefficiencies and hinder timely decision-making.
- Lack of Self-Service Dashboards: The absence of intuitive, self-service dashboards makes it arduous for executives to gain quick insights into win-loss statistics and trends.
- Incomplete Analysis: Without automated integration with popular CRMs like Salesforce, Hubspot, and Microsoft Dynamics 365 Sales, companies struggle to conduct comprehensive analyses of their sales pipelines.
- Delayed Responses: Without real-time data and analytics, companies risk making delayed or erroneous decisions, which can impede their ability to capitalize on opportunities and address challenges effectively.
Benefits of Modern Pipeline Win Loss Dashboards
- Enhanced Visibility: By leveraging modern Pipeline Win Loss Dashboards, SaaS companies gain unparalleled visibility into their sales performance, allowing them to identify trends, patterns, and areas for improvement.
- Informed Decision-Making: Armed with real-time data and analytics, executives can make informed decisions regarding sales strategies, product offerings, pricing, and resource allocation.
- Targeted Training and Development: The detailed analysis provided by Pipeline Win Loss Dashboards enables companies to tailor training and development programs to address specific challenges and enhance the effectiveness of their sales teams.
- Streamlined Operations: Integration with leading CRMs streamlines data collection and analysis, eliminating manual processes and improving operational efficiency.
- Accelerated Growth: By leveraging insights from Pipeline Win Loss Dashboards, SaaS companies can optimize their sales processes, drive revenue growth, and gain a competitive edge in the market.
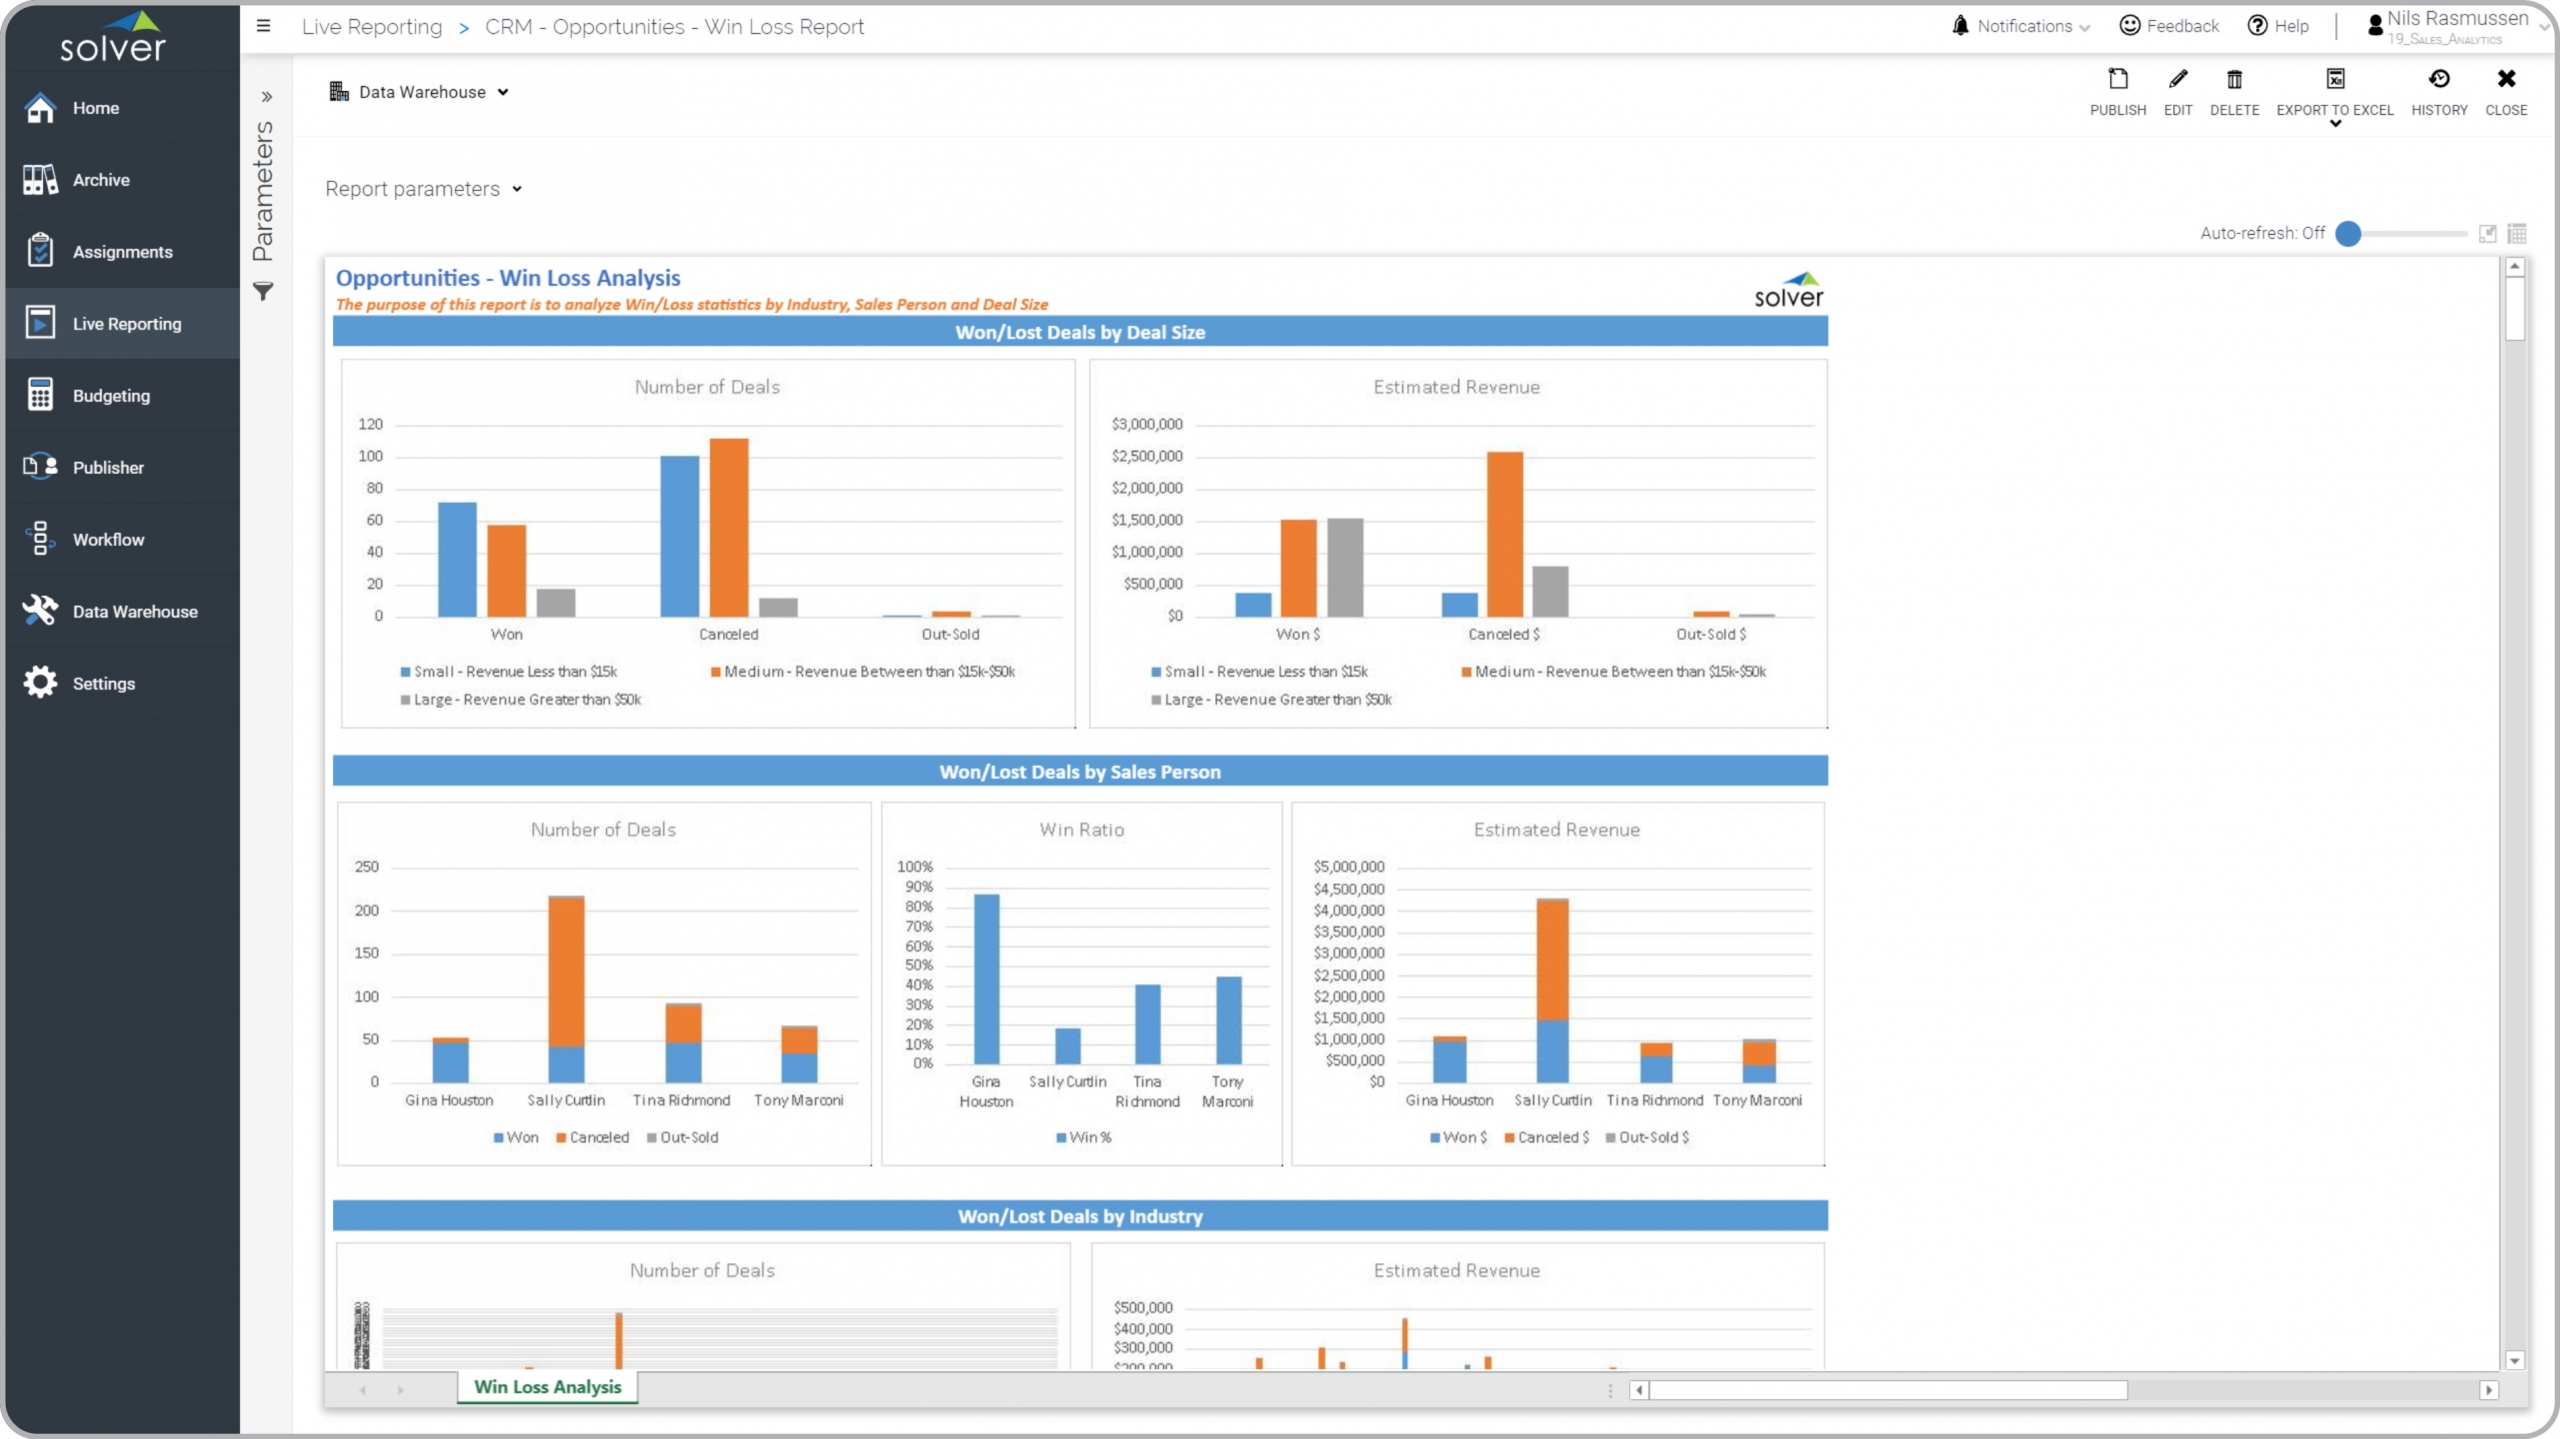
About the Pipeline Win Loss Dashboard
This dashboard breaks down win and loss statistics by deal size, salesperson, and industry. It also shows number of lost and won deals as well as the related revenue. This enables any executive or manager to quickly get an idea of the type of deals that the company is more likely to win, which salespeople have the best win statistics and in which industries the business is most successful.
For this and many other ready-to-use templates from Solver, visit our web-site Marketplace page and download the free SaaS eBook.
Why Consider Solver xFP&A Solution
In light of the challenges faced by SaaS companies and the transformative benefits of modern Pipeline Win Loss Dashboards, implementing a comprehensive xFP&A solution like Solver emerges as a strategic imperative. Solver offers more than 150 pre-built reports, dashboards, and budgeting templates, empowering companies to automate and streamline their reporting, analysis, and budgeting processes. With direct integration with popular CRMs, Solver provides a seamless and efficient way for executives to make critical decisions related to sales, marketing, and product strategies. By embracing Solver, SaaS companies can unlock the full potential of their data, drive strategic growth initiatives, and stay ahead of the competition in today's dynamic marketplace.
Resources for Additional SaaS Reports, Dashboards and Budget Models
For more information about all the SaaS templates from Solver check out these resources:
- Solver SaaS model information and demonstration video
- Take a self-guided tour of the Solver FP&A suite
- Contact Solver for a personal demo or a quote
This Solver report template connects directly to your ERP data via the Solver Data Warehouse, enabling near real-time analysis with minimal setup. Designed for QuickStart deployment, it can be activated rapidly so your team can focus on analysis and decisions — not data preparation.
What is the Win Loss Analysis Report in Solver? The Win Loss Analysis Report is a pre-built xFP&A report template in Solver that delivers key financial and operational metrics in a single, easy-to-use interface, eliminating the need for manual data work or custom report development.
Who uses this Solver report template? Cfos, fp&a managers, and controllers rely on this Solver report template for consistent, parameter-driven reporting that can be run on demand or on a scheduled basis. It eliminates the manual work typically required to produce this type of analysis.
Where does the data come from? Data is sourced automatically from your ERP system through the Solver Data Warehouse, which integrates with platforms such as Microsoft Dynamics 365 Business Central, Dynamics 365 Finance, Acumatica, Sage Intacct, and other leading ERP solutions. Once connected, the template updates in near real-time with no manual data entry required.