

View Favorites
Bank – Loan Performance
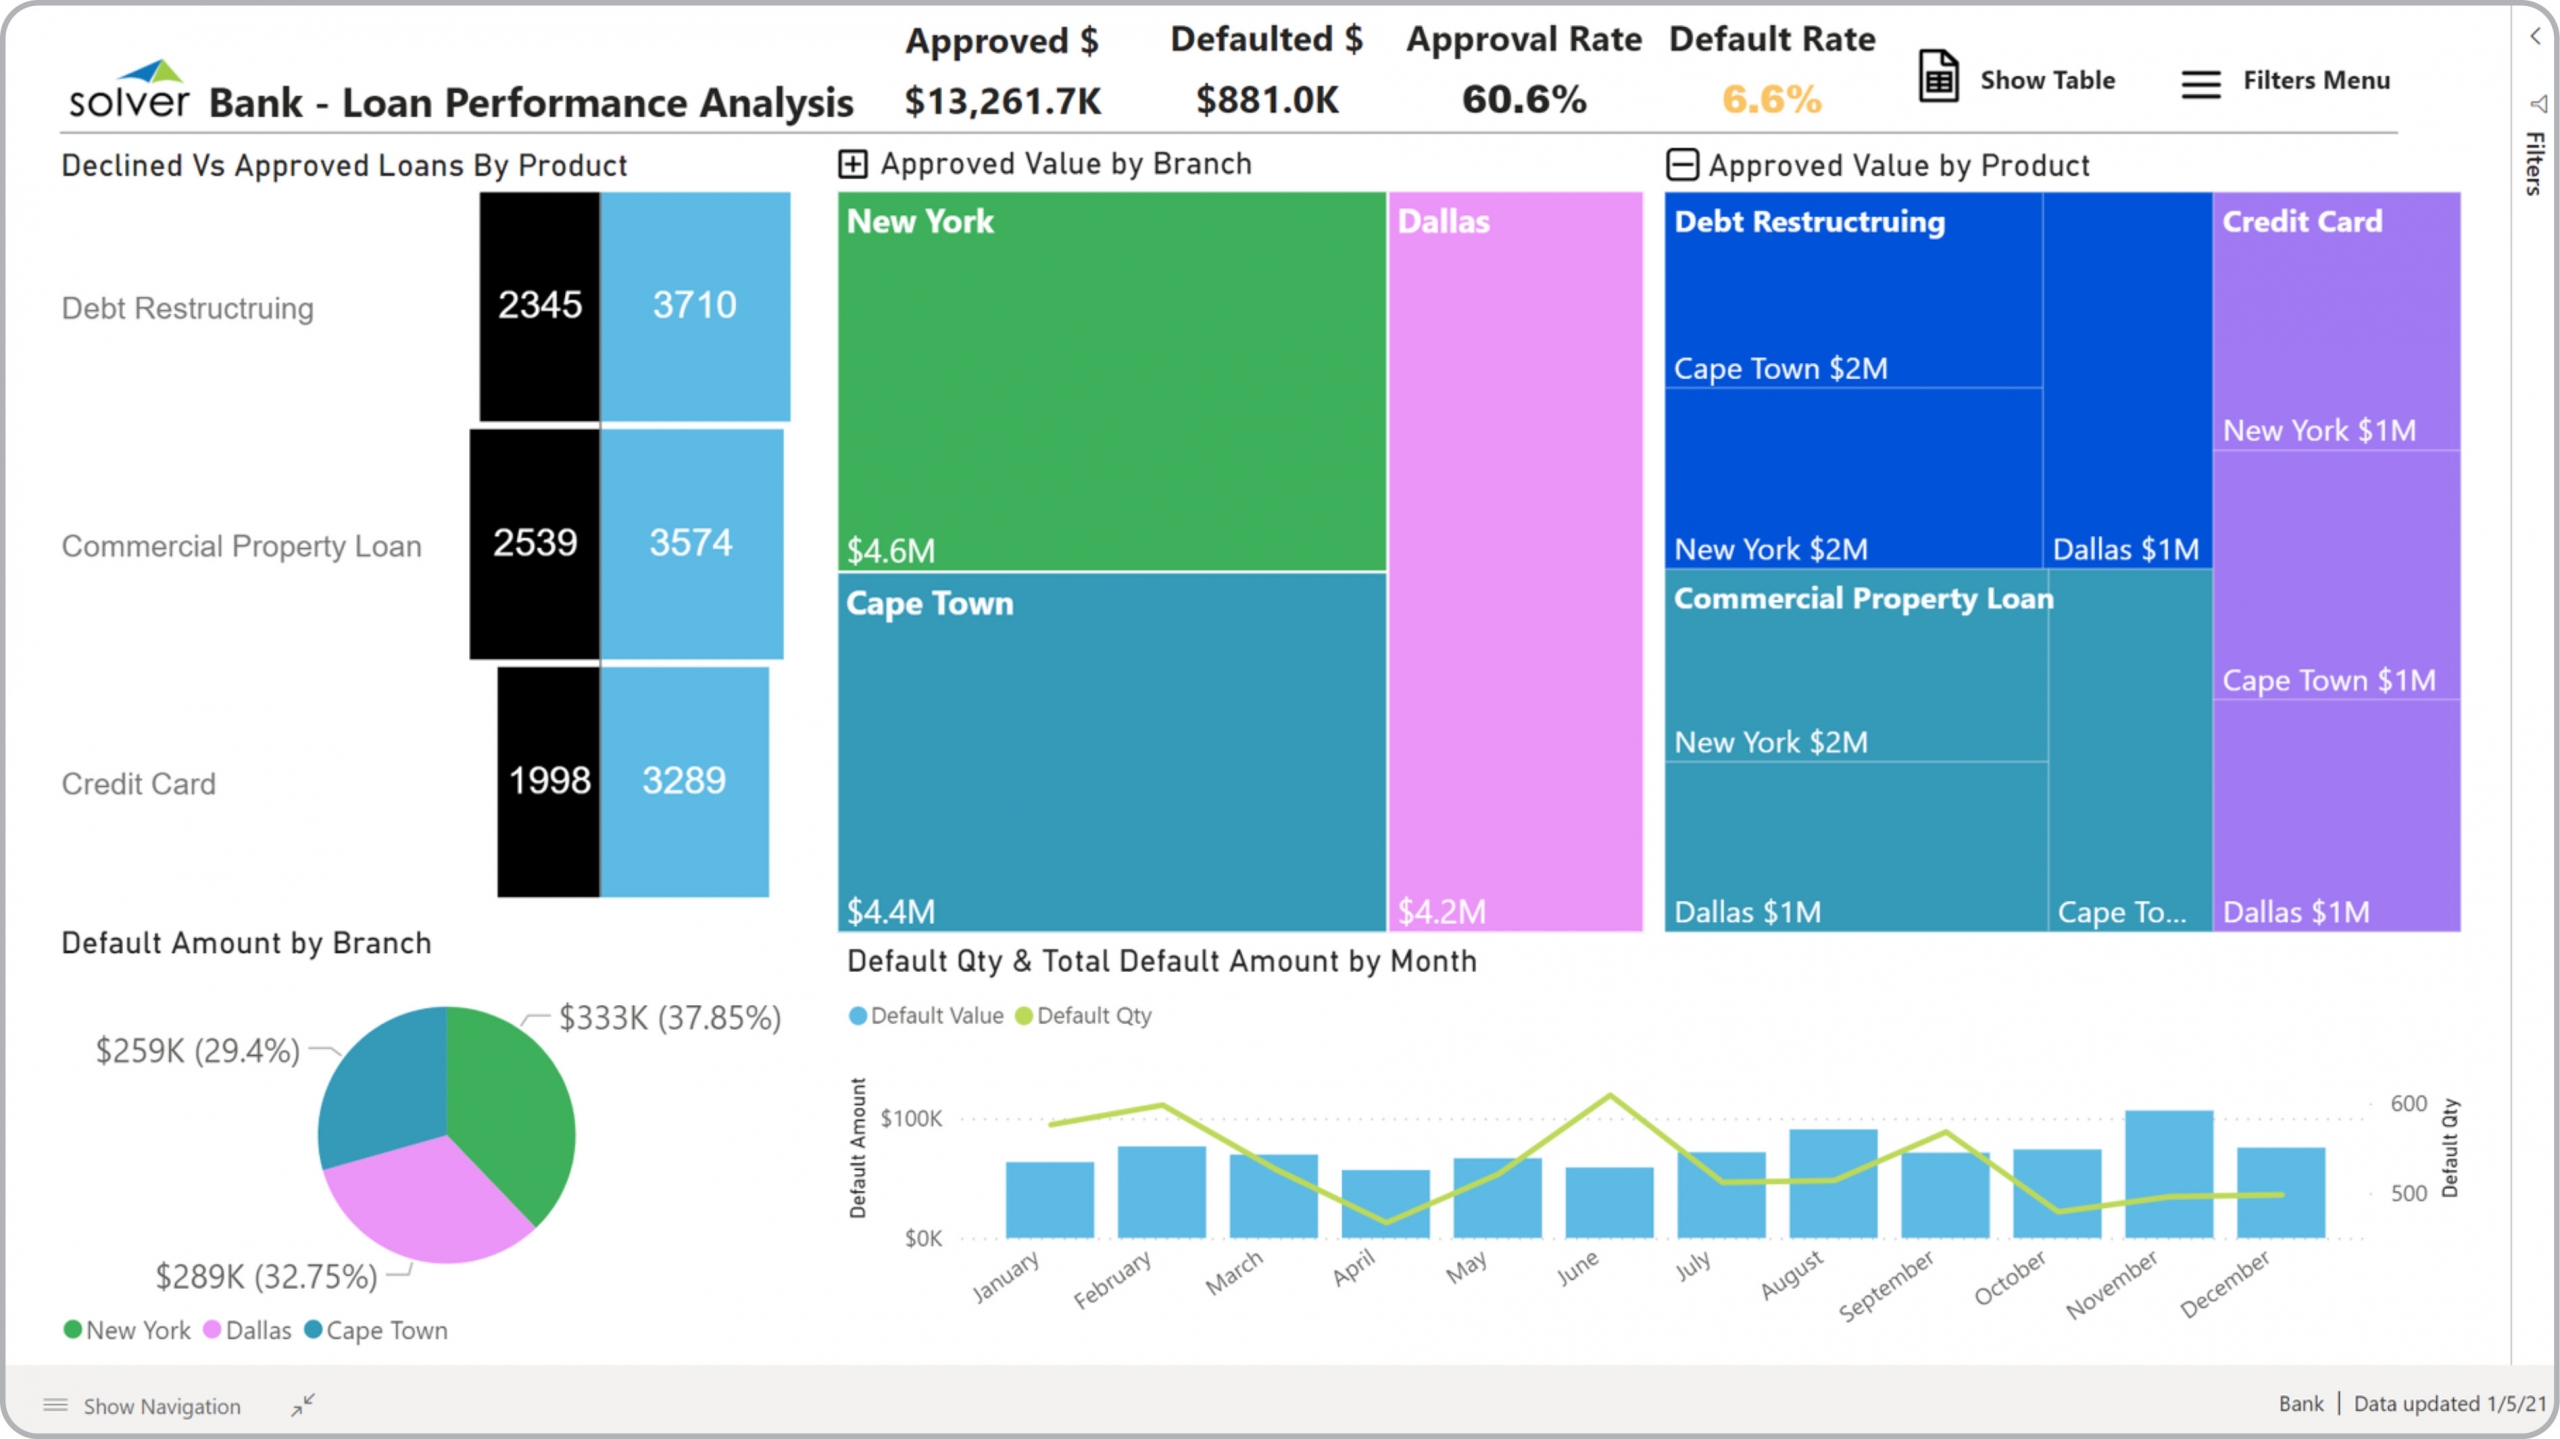
Power BI dashboard for declined vs approved loans by product, loan defaults by branch, default trend, loans approved.
What is a Loan Dashboard for Banks? Loan Dashboards are considered operational monitoring tools and are used by executives and loan managers to analyze key trends and metrics for their loan portfolios. Some of the main functionality in this type of dashboards is that it provides performance analysis across six different perspectives: 1) Declined and approved loans by product, 2) Approved loan value by bank branch, 3) Approved loan value by product, 4) Default amount by branch, 5) Monthly trend in default quantities and values, and 6) KPIs for total approved and default loan values, and percent approval/default value. You find an example of this type of dashboards below.
Purpose of Loan Dashboards Banks use Loan Dashboards to quickly detect anomalies or trends in their loan business. When used as part of good business practices in Loan- and Financial Planning & Analysis (FP&A) departments, a company can improve its loan strategies and related revenues, and it can reduce the chances that managers miss trends or correlations related to approvals and defaults.
Who Uses This Type of Dashboards? The typical users of this type of dashboards are: Executives, CFOs, loan managers. Other Reports Often Used in Conjunction with Loan Dashboards Progressive Loan- and Financial Planning & Analysis (FP&A) departments sometimes use several different Loan Dashboards, along with detailed loan approval reports, loans declined reports, loan defaults reports, loan revenue reports, corporate dashboards, consolidated and branch-level profit & loss reports, balance sheets, cash flow statements, detailed operational dashboards, and other management and control tools.
Where Does the Data for Analysis Originate From? The Actual (historical transactions) data typically comes from loan management software and enterprise resource planning (ERP) systems like: Microsoft Dynamics 365 (D365) Finance, Microsoft Dynamics 365 Business Central (D365 BC), Microsoft Dynamics AX, Microsoft Dynamics NAV, Microsoft Dynamics GP, Microsoft Dynamics SL, Sage Intacct, Sage 100, Sage 300, Sage 500, Sage X3, SAP Business One, SAP ByDesign, Acumatica, Netsuite and others. In analyses where budgets or forecasts are used, the planning data most often originates from in-house Excel spreadsheet models or from professional xFP&A solutions.
To learn more, visit the Resource Library.
View Favorites