

View Favorites
Higher Ed – Revenue Dashboard
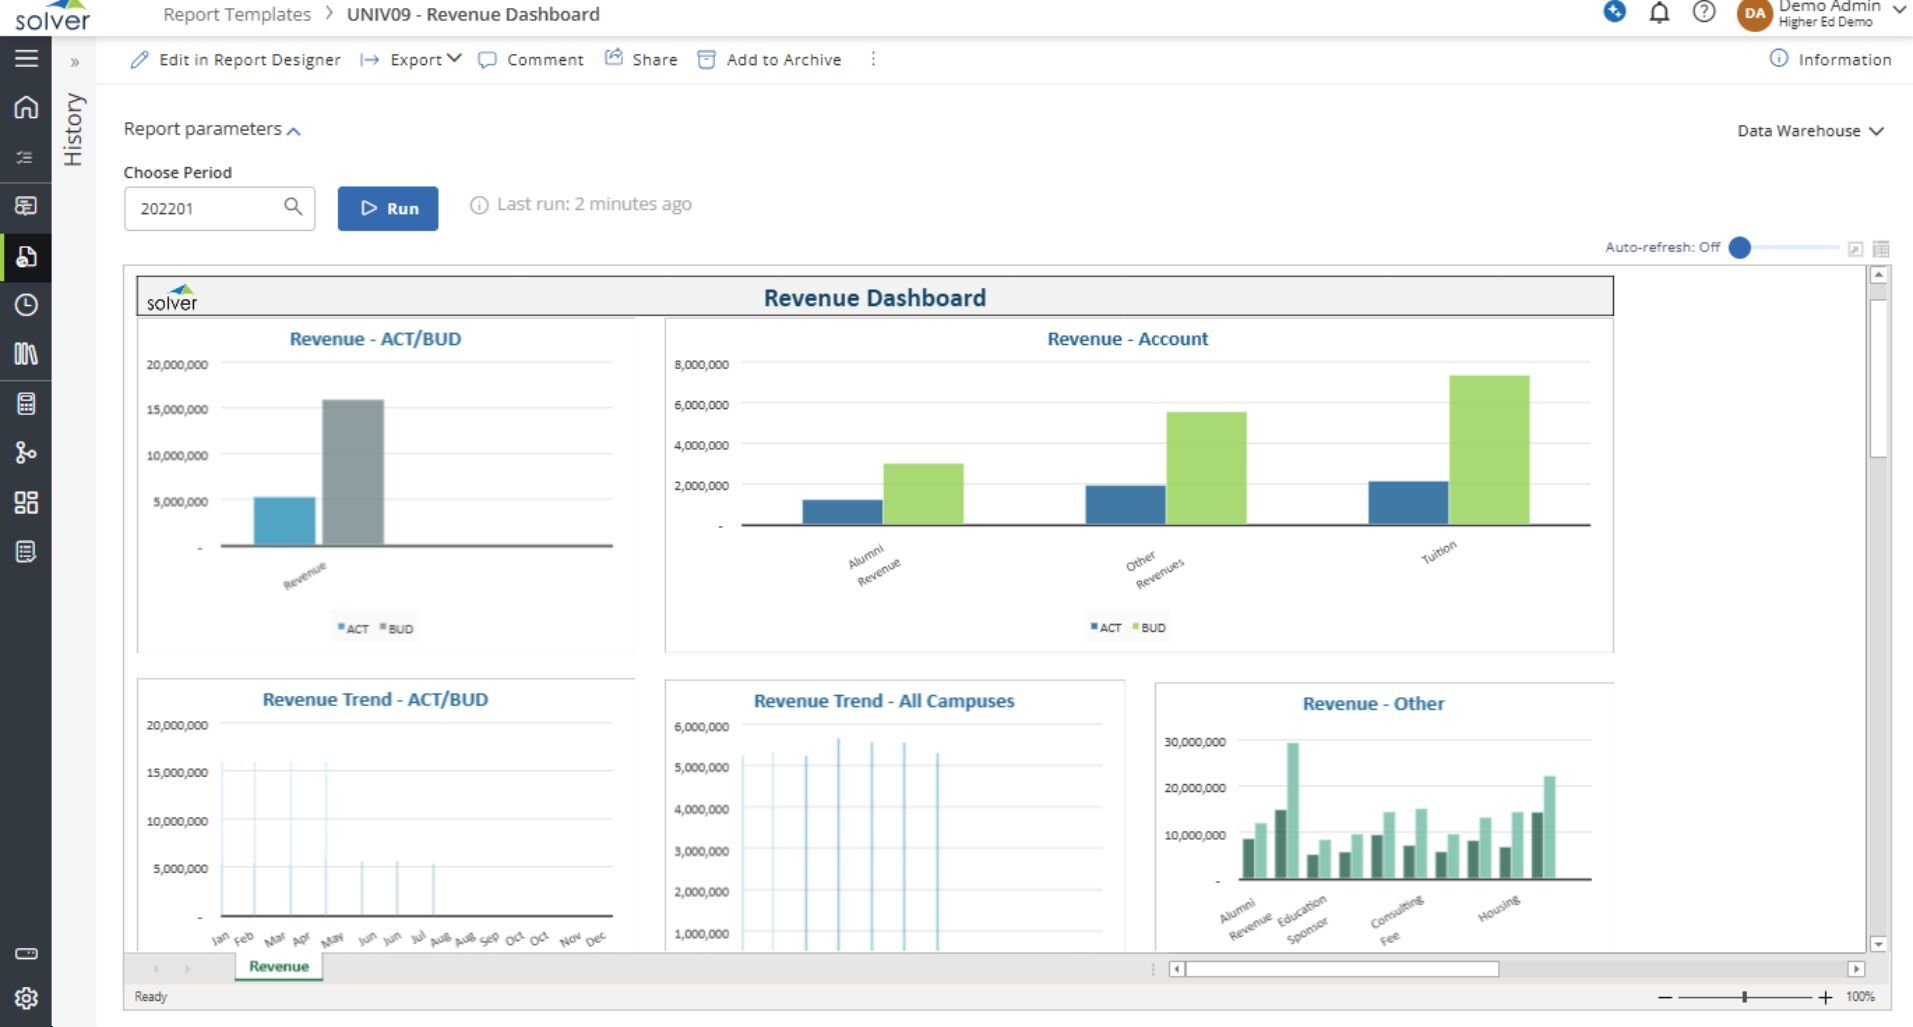
This graphical report breaks down revenue by month, by type and actual vs budget.
What is a Higher Education Revenue Dashboard? Revenue dashboards are considered executive analysis tools and are used by financial officers and leaders to analyze trends and budget variances for the institution's revenues. Some of the main functionality in this type of visualization report is that it provides insight into revenues from five different perspectives: 1) Actual versus budget for the current period, 2) Actual versus budget broken down by major revenue categories such as for Alumni, Tuition and Other, 3) Actual and budget revenue trend, 4) Revenue trend consolidated for all schools and/or campuses, and 5) Revenue for the current period broken down by detail account. You find an example of this type of visualization report below.
Purpose of Revenue Dashboards Universities and colleges use Revenue Dashboards to provide executives with an easy, self-service method of analyzing essential revenue metrics. When used as part of good business practices in a Financial Planning & Analysis (FP&A) department, a higher education institution can improve its revenue-related strategies, and it can reduce the chances that the decisions are slowed down because managers lack clear and on-demand revenue insights.
Who Uses This Type of Visualization report? The typical users of this type of visualization report are: Financial officers, executives, boards. Other Visualization and Reports Often Used in Conjunction with Revenue Dashboards Progressive Financial Planning & Analysis (FP&A) departments sometimes use several different Revenue Dashboards, along with trial balances, consolidation reports, sources and uses of funds, balance sheets, KPI dashboards, transactional revenue reports and other management and control tools.
Where Does the Data for Analysis Originate From? The Actual (historical transactions) data typically comes from enterprise resource planning (ERP) systems like: Microsoft Dynamics 365 (D365) Finance, Microsoft Dynamics 365 Business Central (D365 BC), Microsoft Dynamics AX, Microsoft Dynamics NAV, Microsoft Dynamics GP, Microsoft Dynamics SL, Sage Intacct, Sage 100, Sage 300, Sage 500, Sage X3, SAP Business One, SAP ByDesign, Acumatica, Netsuite and others. In analyses where budgets or forecasts are used, the planning data most often originates from in-house Excel spreadsheet models or from professional xFP&A solutions.
To learn more, visit the Resource Library.
View Favorites