

View Favorites
Sports – Financial Dashboard
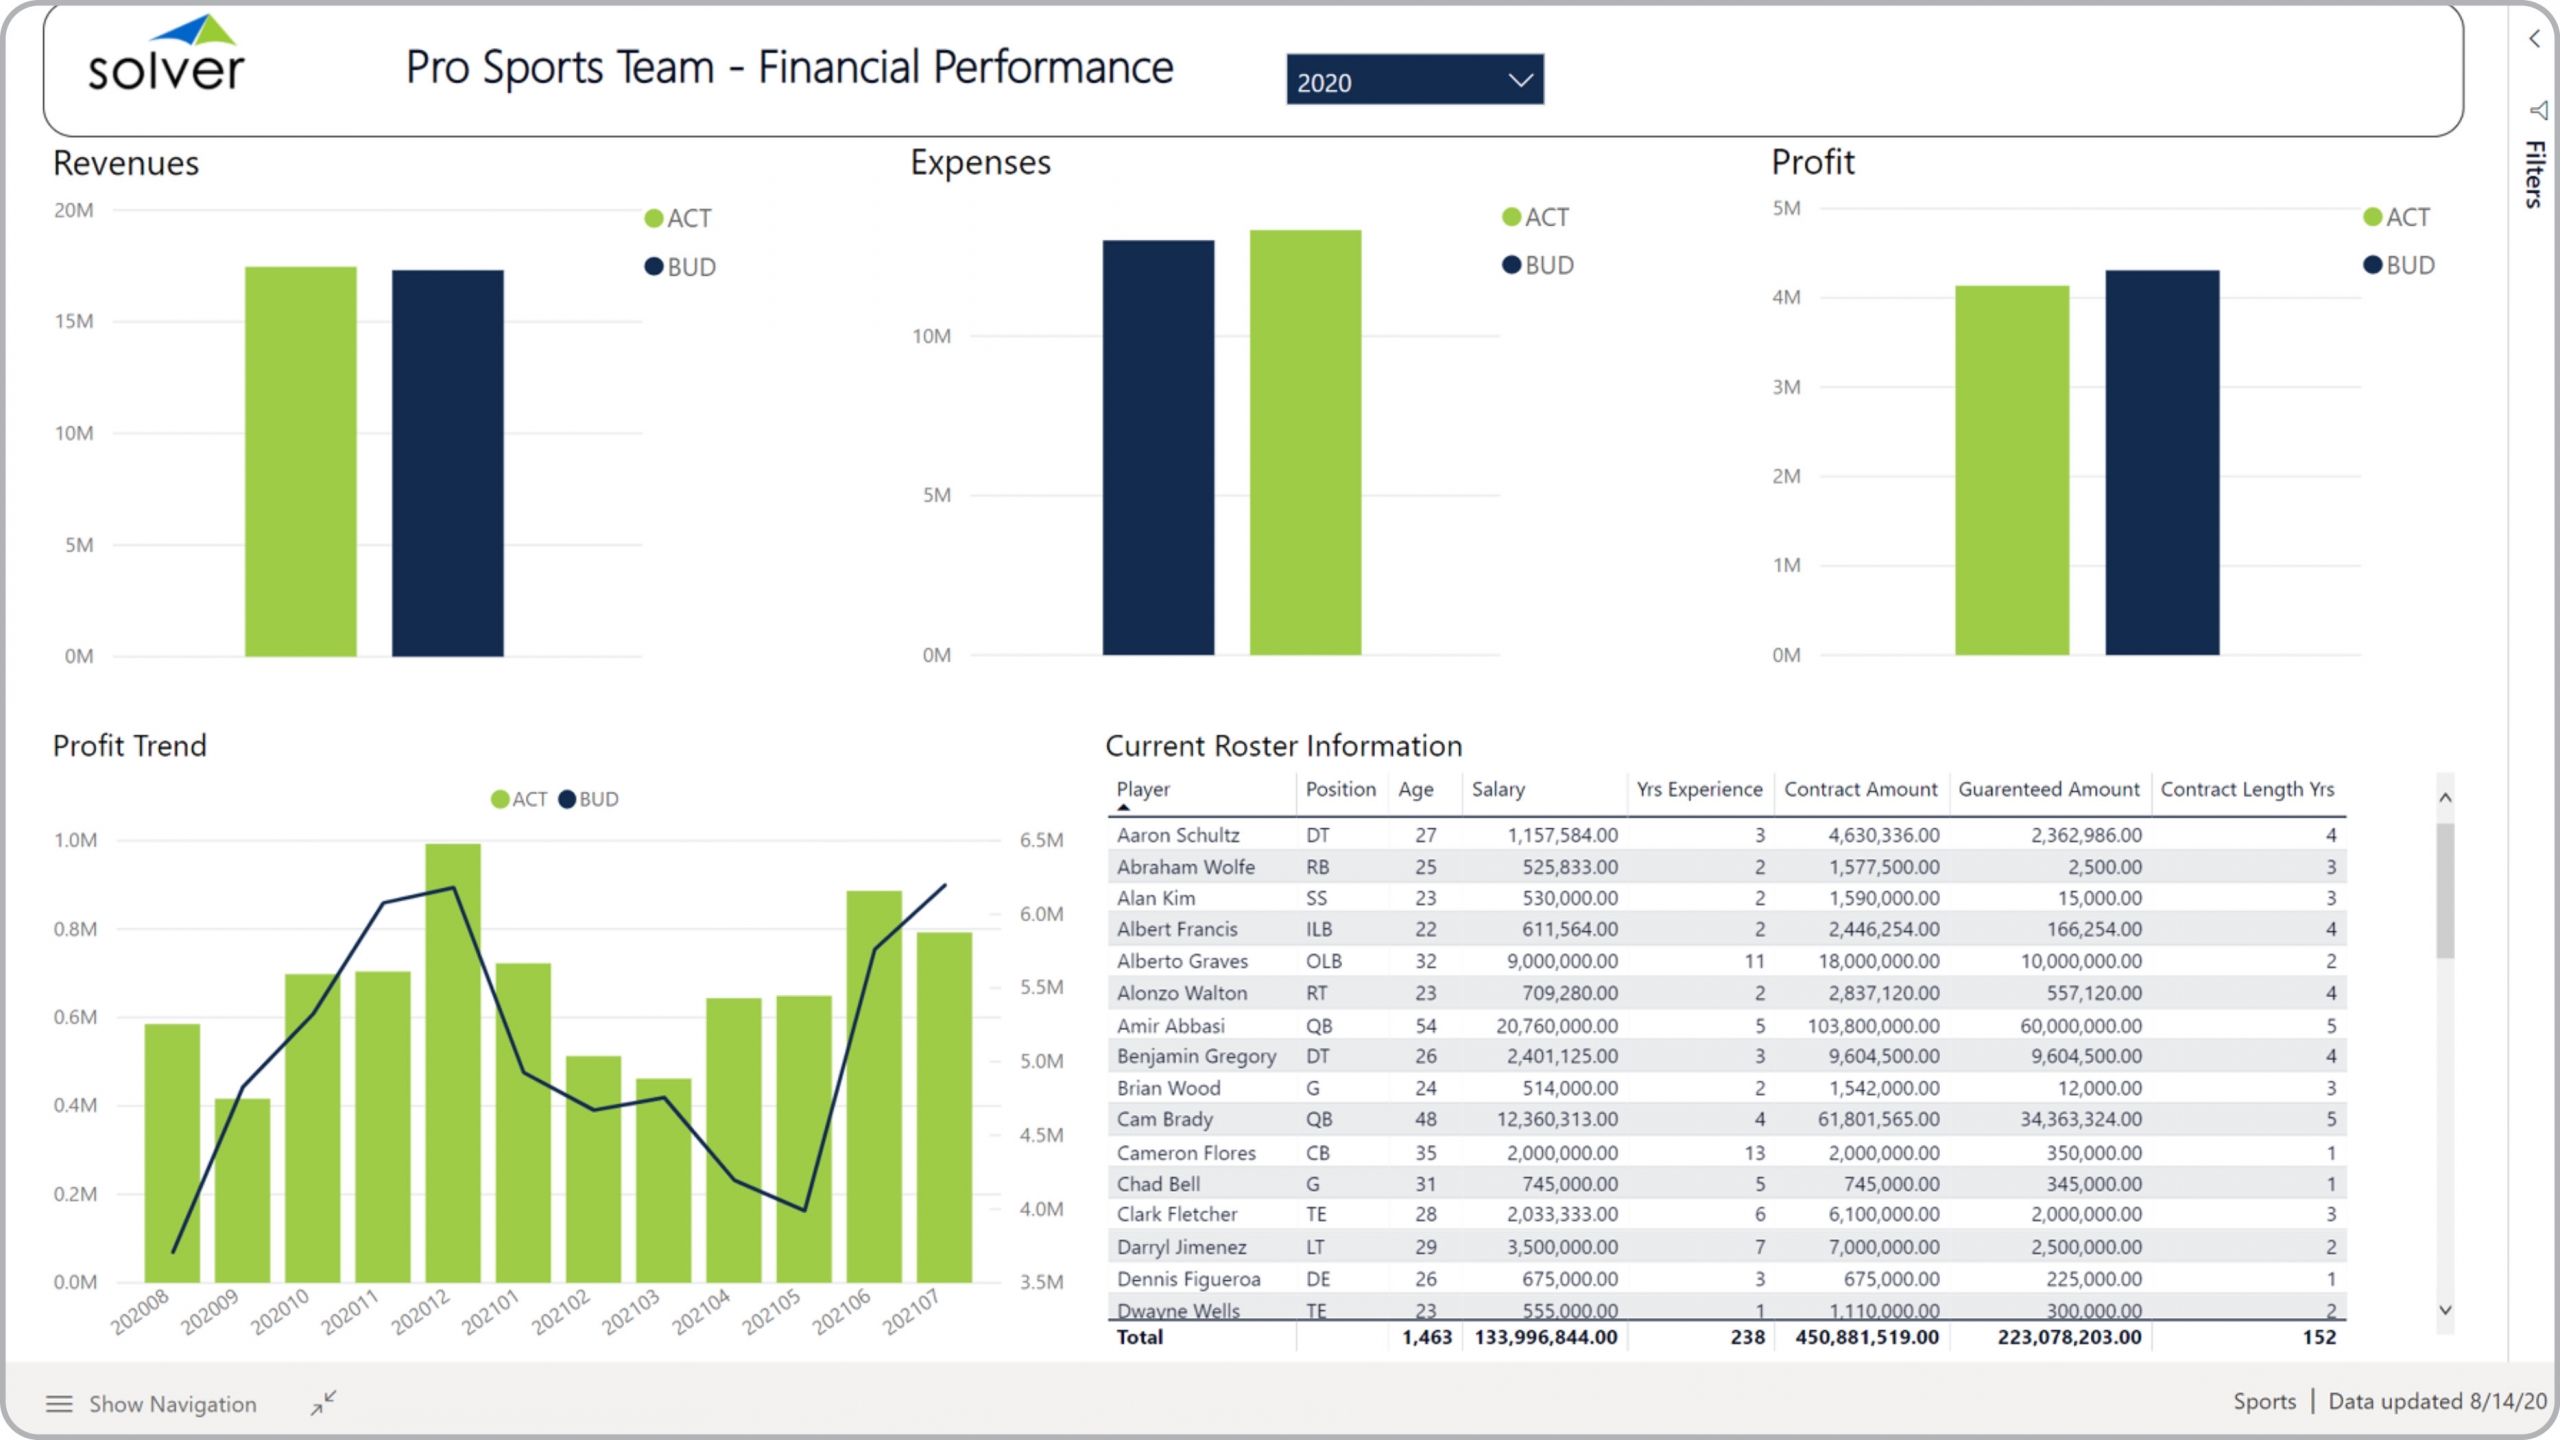
Power BI dashboard showing actual vs budget and trend for key financial KPIs. Also shows roster metrics.
What is a Financial Dashboard for Professional Sports Teams? Financial Dashboards are considered financial monitoring tools and are used by CFOs and team owners to analyze aggregate revenue and expense KPIs as well as related player metrics. Some of the main functionality in this type of dashboard is that it provides trends and KPIs from five different perspectives: 1) Actual versus budgeted revenues, 2) Actual versus budgeted expenses, 3) Actual versus budgeted profit, 4) Profitability trend, and 5) Current player roster with metrics for position, age, salary, years experience, contract amount, guaranteed amount and contract length in years. You find an example of this type of dashboard below.
Purpose of Financial Dashboards with Player Metrics Professional sports organizations use Financial Dashboards with Player Metrics to give managers and stakeholders an easy way to monitor key performance metrics. When used as part of good business practices in Financial Planning & Analysis (FP&A) departments, an organization can improve its decision-making and related outcomes, and it can reduce the chances that executives do not have a timely and clear understanding of key performance issues.
Who Uses This Type of Dashboard? The typical users of this type of dashboard are: Team owners, executives, CFOs. Other Reports Often Used in Conjunction with Financial Dashboards with Player Metrics Progressive Financial Planning & Analysis (FP&A) departments sometimes use several different Financial Dashboards, along with profit & loss reports, cash flow statements, annual budgets and forecasts, revenue dashboards and other management and control tools.
Where Does the Data for Analysis Originate From? The Actual (historical transactions) data typically comes from enterprise resource planning (ERP) systems like: Microsoft Dynamics 365 (D365) Finance, Microsoft Dynamics 365 Business Central (D365 BC), Microsoft Dynamics AX, Microsoft Dynamics NAV, Microsoft Dynamics GP, Microsoft Dynamics SL, Sage Intacct, Sage 100, Sage 300, Sage 500, Sage X3, SAP Business One, SAP ByDesign, Acumatica, Netsuite and others. In analyses where budgets or forecasts are used, the planning data most often originates from in-house Excel spreadsheet models or from professional xFP&A solutions.
To learn more, visit the Resource Library.
View Favorites