

Compensation & Headcount
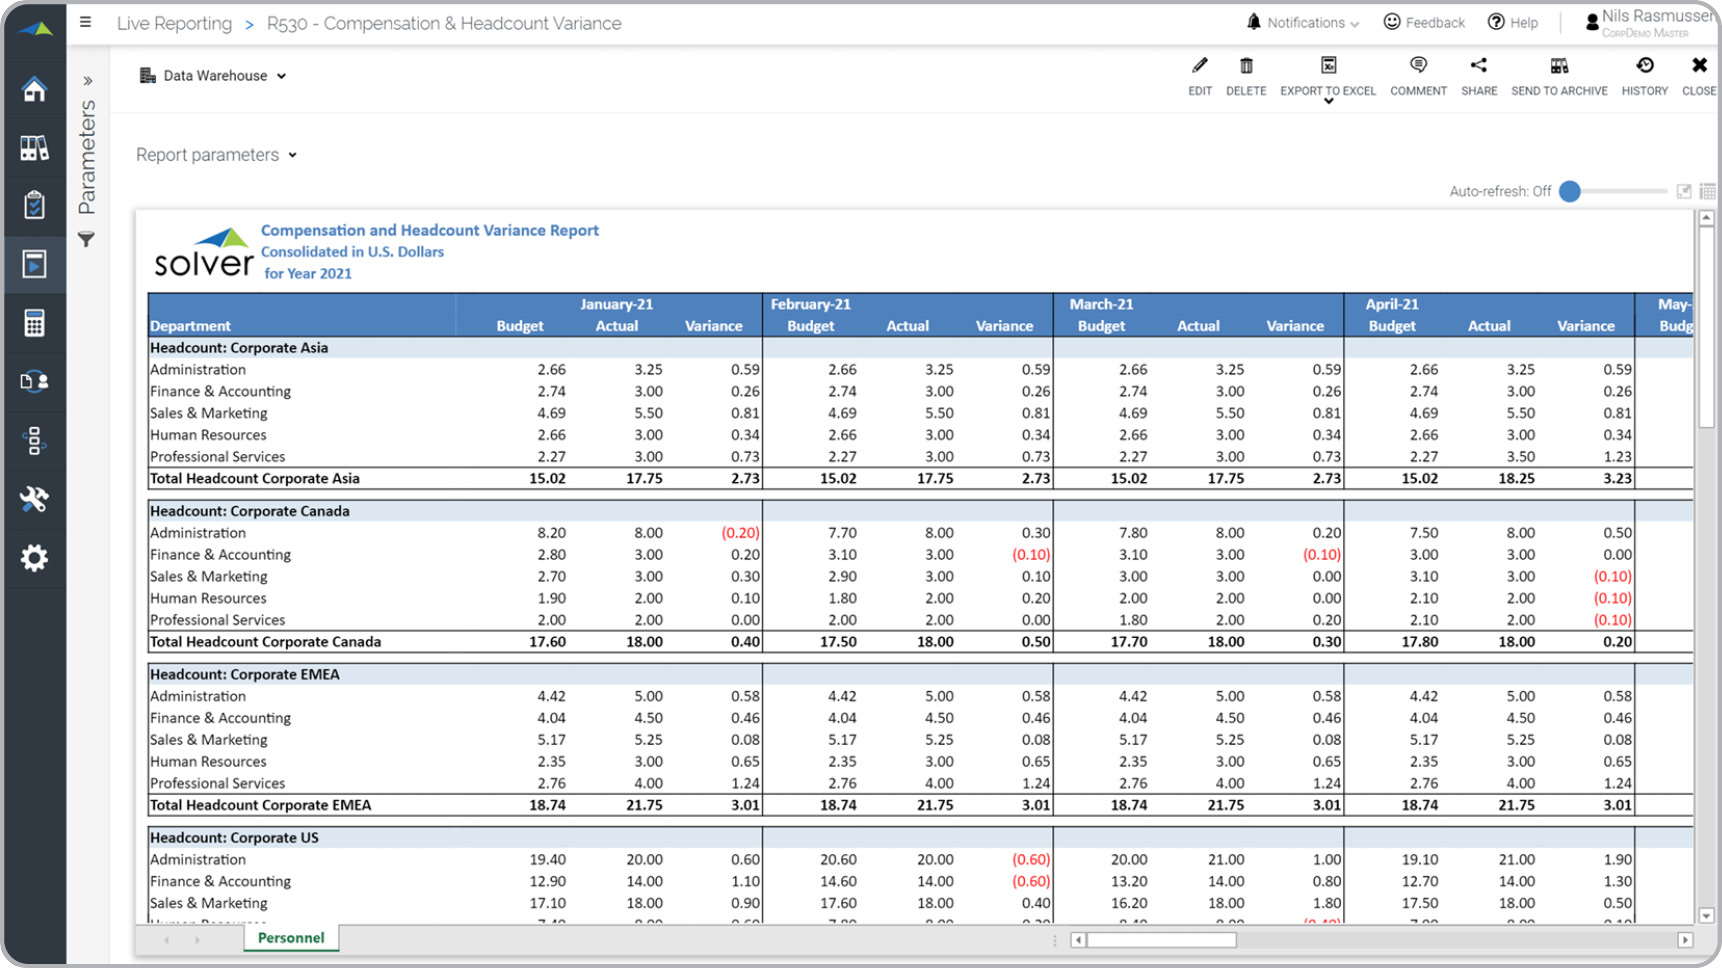
What is a Compensation & Headcount Variance Report? Salary and Full-time Equivalent (FTE) reports are considered employee or HR reports and are often used by HR and other managers to get a complete overview of headcount and compensation status versus plan. Some key functionality in this type of report displays actual and budget FTE figures per department and division for each month of the year. It also shows (not visible in the screenshot below) total compensation per department along with variance from plan. You will find an example of this type of report below.
Purpose of Compensation & Headcount Variance Reports Companies and organizations use Compensation & Headcount Variance Reports to get a complete month-by-month overview of number of staff members and related compensation costs compared to the budget for the year. When used as part of good business practices in a Human Resource (HR) department, a company can improve its ability to track results of recruiting and retention efforts, and reduce the chances that any important exceptions versus originally planned FTEs and salary expenses are missed.
Who Uses This Type of Report? The typical users of this type of report are: HR and Payroll Managers. Other Reports Often Used in Conjunction with Compensation & Headcount Variance Reports Progressive Human Resource (HR) department Departments sometimes use several different Compensation & Headcount Variance Reports, along with salary and employee reports and dashboards and other management and control tools.
Where Does the Data for Analysis Originate From? The Actual (historical transactions) data typically comes from enterprise resource planning (ERP) systems like: Microsoft Dynamics 365 (D365) Finance, Microsoft Dynamics 365 Business Central (D365 BC), Microsoft Dynamics AX, Microsoft Dynamics NAV, Microsoft Dynamics GP, Microsoft Dynamics SL, Sage Intacct, Sage 100, Sage 300, Sage 500, Sage X3, SAP Business One, SAP ByDesign, Acumatica, Netsuite and others. In analyses where budgets or forecasts are used, the planning data most often originates from in-house Excel spreadsheet models or from professional xFP&A solutions.
This Solver report template connects directly to your ERP data via the Solver Data Warehouse, enabling near real-time analysis with minimal setup. Designed for QuickStart deployment, it can be activated rapidly so your team can focus on analysis and decisions — not data preparation.
What is the Compensation & Headcount in Solver? The Compensation & Headcount is a pre-built xFP&A report template in Solver that delivers key financial and operational metrics in a single, easy-to-use interface, eliminating the need for manual data work or custom report development.
Who uses this Solver report template? This template is primarily used by CFOs, FP&A managers, and controllers who need accurate, timely reporting without manual data preparation. It is also valuable for department heads and business unit leaders who need periodic performance summaries.
Where does the data come from? Data is sourced automatically from your ERP system through the Solver Data Warehouse, which integrates with platforms such as Microsoft Dynamics 365 Business Central, Dynamics 365 Finance, Acumatica, Sage Intacct, and other leading ERP solutions. Once connected, the template updates in near real-time with no manual data entry required.
To learn more, visit the Resource Library.