

Solver-markedet
Utforsk etter funksjonalitet (rapporter, planlegging og dashbordmaler), eller bruk søkefunksjonen til å filtrere etter integrasjon, bransje eller for å finne en mal som passer dine spesifikke behov. Lagre maler i favorittlisten din, og bruk lenken «Del favoritter» for å dele listen med andre.
Ikonforklaring:
💲 Krever konsulenttimer for å sette opp og konfigurere
⭐ Lagre som favoritt og del med andre
FUNCTIONALITY
- Reports
- Planning
- Dashboard
Data Source
Marketplace Data Source: Filter by Data Source to find assets specific to your system
Showcase Data Source: Filter by Data Source to find assets specific to your system
Industries
Marketplace Industries: Filter by Industries to find assets specific to your system
Showcase Industries: Filter by Industries to find assets specific to your system
industries
Marketplace Industries: Filter by your industry to find assets created for your specific needs
Showcase Industries: Filter by your industry to find assets created for your specific needs
607 - 612 of 868 Results
Favorite Page Results
Favorites


Reports
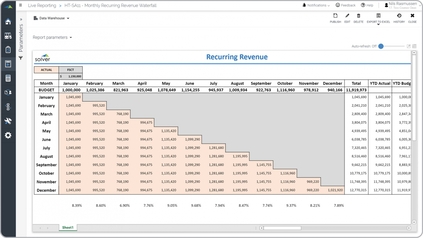
Tech – Recurring Revenue Waterfall
Waterfall reports for recurring revenues are considered subscription analysis tools and are often used by sales executives and budgeting managers to track current and future recurring revenues.
$
Planning
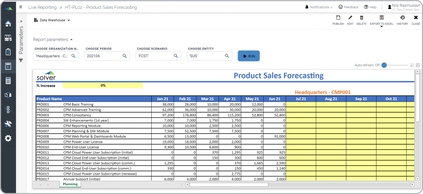
Tech – Sales Forecast
Some of the key functionality input model is that it dynamically displays actual sales for each month up to the current period and the user can input the forecast for the remaining months.
$
Dashboard
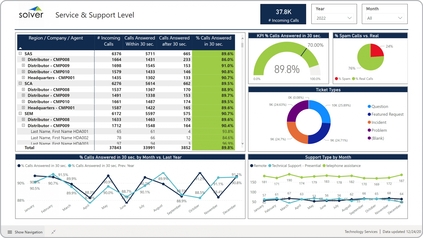
Tech – Service and Support Level
It provides an easy way for leaders to analyze helpdesk metrics from seven different perspectives, including:.
$
Reports
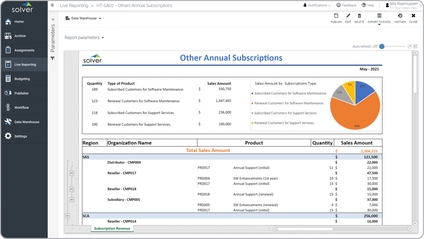
Tech – Subscription Sales by Product
It displays KPIs and charts as a summary on top of the report with detailed transactions and aggregate totals at the bottom.
$
Reports
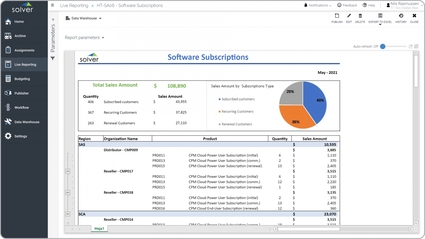
Tech – Subscription Sales by Type
It presents KPIs and charts as a summary on top of the report with detailed transactions at the bottom.
$
Dashboard
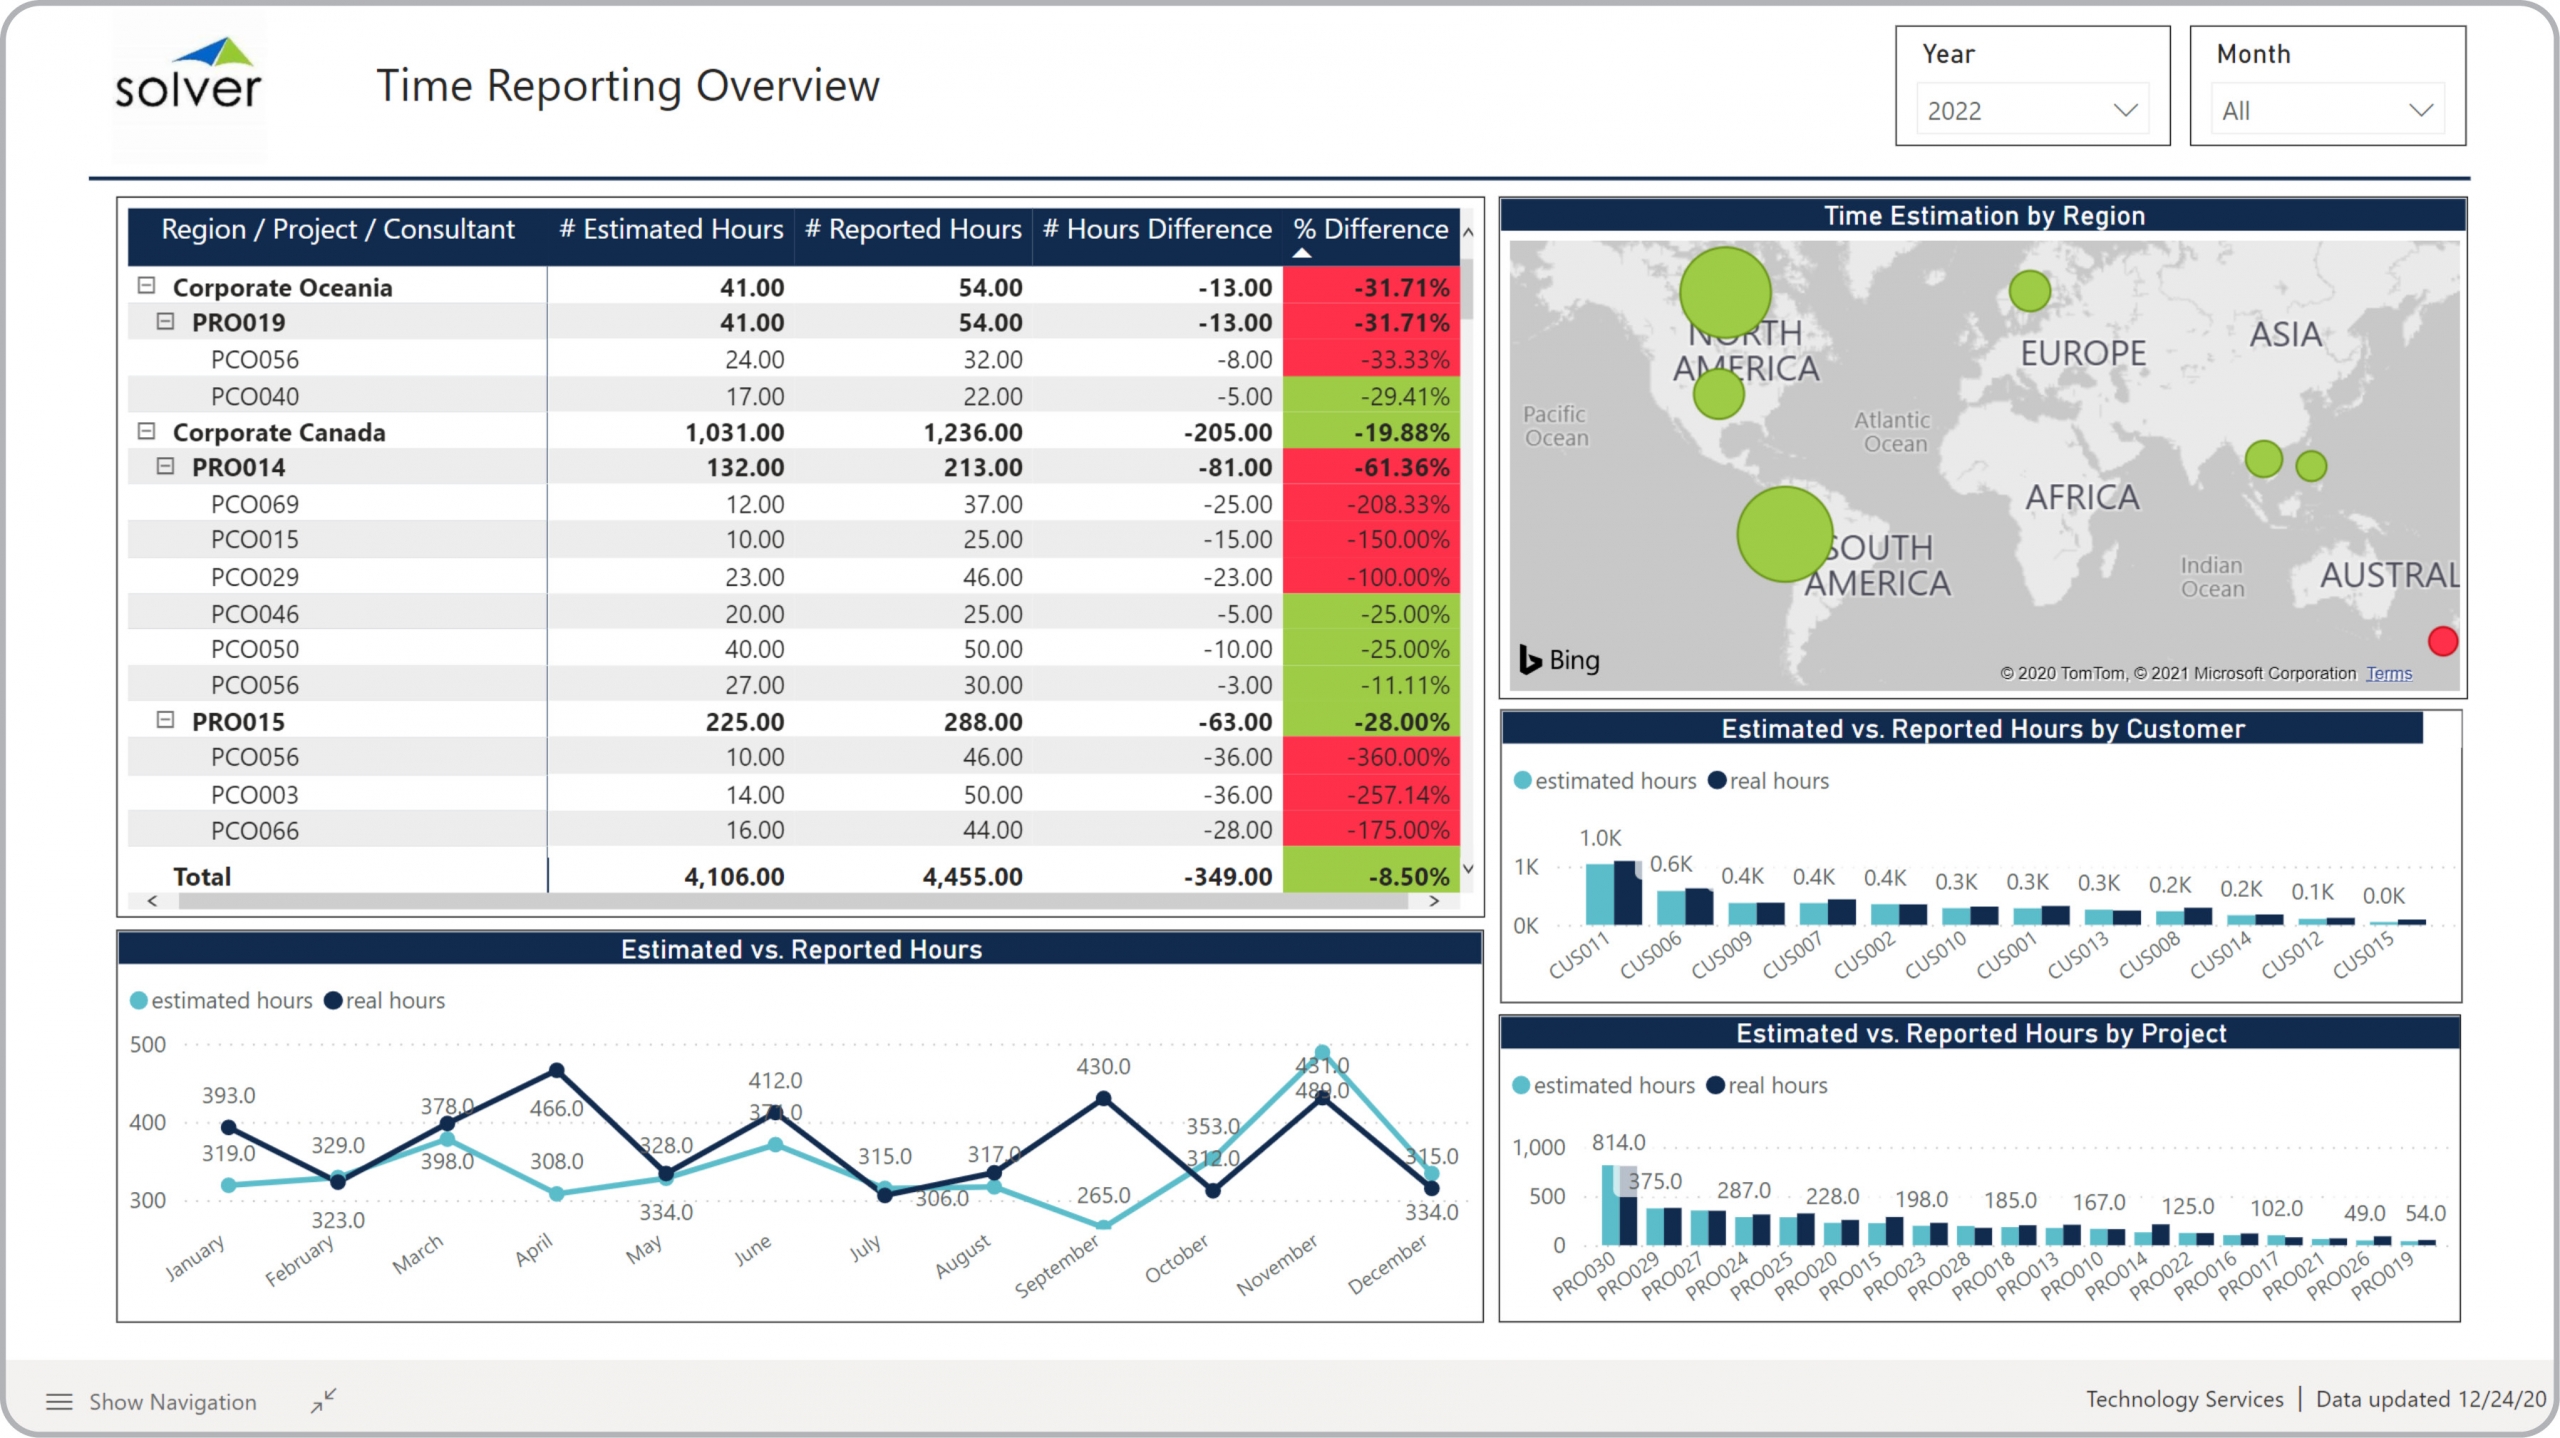
Tech – Time Reporting Overview
It provides monitoring of hours across five different perspectives:. Table by region/project/consultant and with metrics for Estimated hours, reported hours and variance,.
$