

Solver-markedet
Utforsk etter funksjonalitet (rapporter, planlegging og dashbordmaler), eller bruk søkefunksjonen til å filtrere etter integrasjon, bransje eller for å finne en mal som passer dine spesifikke behov. Lagre maler i favorittlisten din, og bruk lenken «Del favoritter» for å dele listen med andre.
Ikonforklaring:
💲 Krever konsulenttimer for å sette opp og konfigurere
⭐ Lagre som favoritt og del med andre
FUNCTIONALITY
- Reports
- Planning
- Dashboard
Data Source
Marketplace Data Source: Filter by Data Source to find assets specific to your system
Showcase Data Source: Filter by Data Source to find assets specific to your system
Industries
Marketplace Industries: Filter by Industries to find assets specific to your system
Showcase Industries: Filter by Industries to find assets specific to your system
industries
Marketplace Industries: Filter by your industry to find assets created for your specific needs
Showcase Industries: Filter by your industry to find assets created for your specific needs
601 - 606 of 868 Results
Favorite Page Results
Favorites


Reports
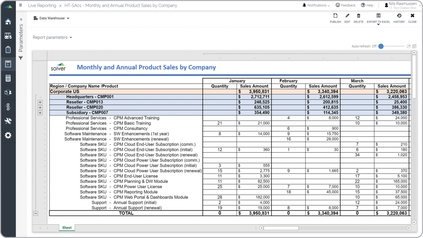
Tech – Monthly Product Sales
It displays January through December across the columns and shows both quantity and amount for each month.
$
Reports
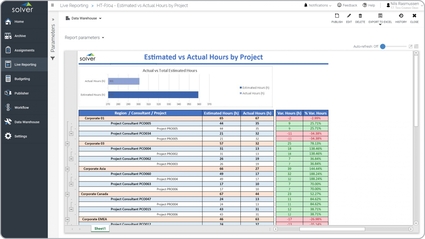
Tech – Project Hours Analysis
It is parameter driven and can be run for any month, entity and project(s).
$
Reports
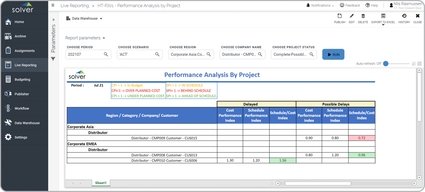
Tech – Project Performance
It tracks projects with a score for Delays or Possible Delays. Within these two areas, the report scores both the related cost and the scheduling.
$
Dashboard
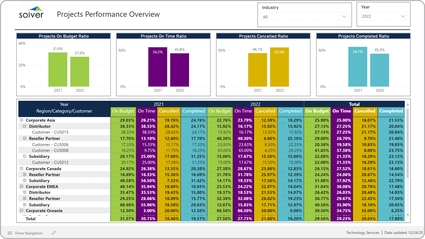
Tech – Project Performance Overview
It provides KPI analysis from five different perspectives. Percent of projects on budget with comparison to prior year,. Percent of projects on time with prior year comparison,.
$
Reports
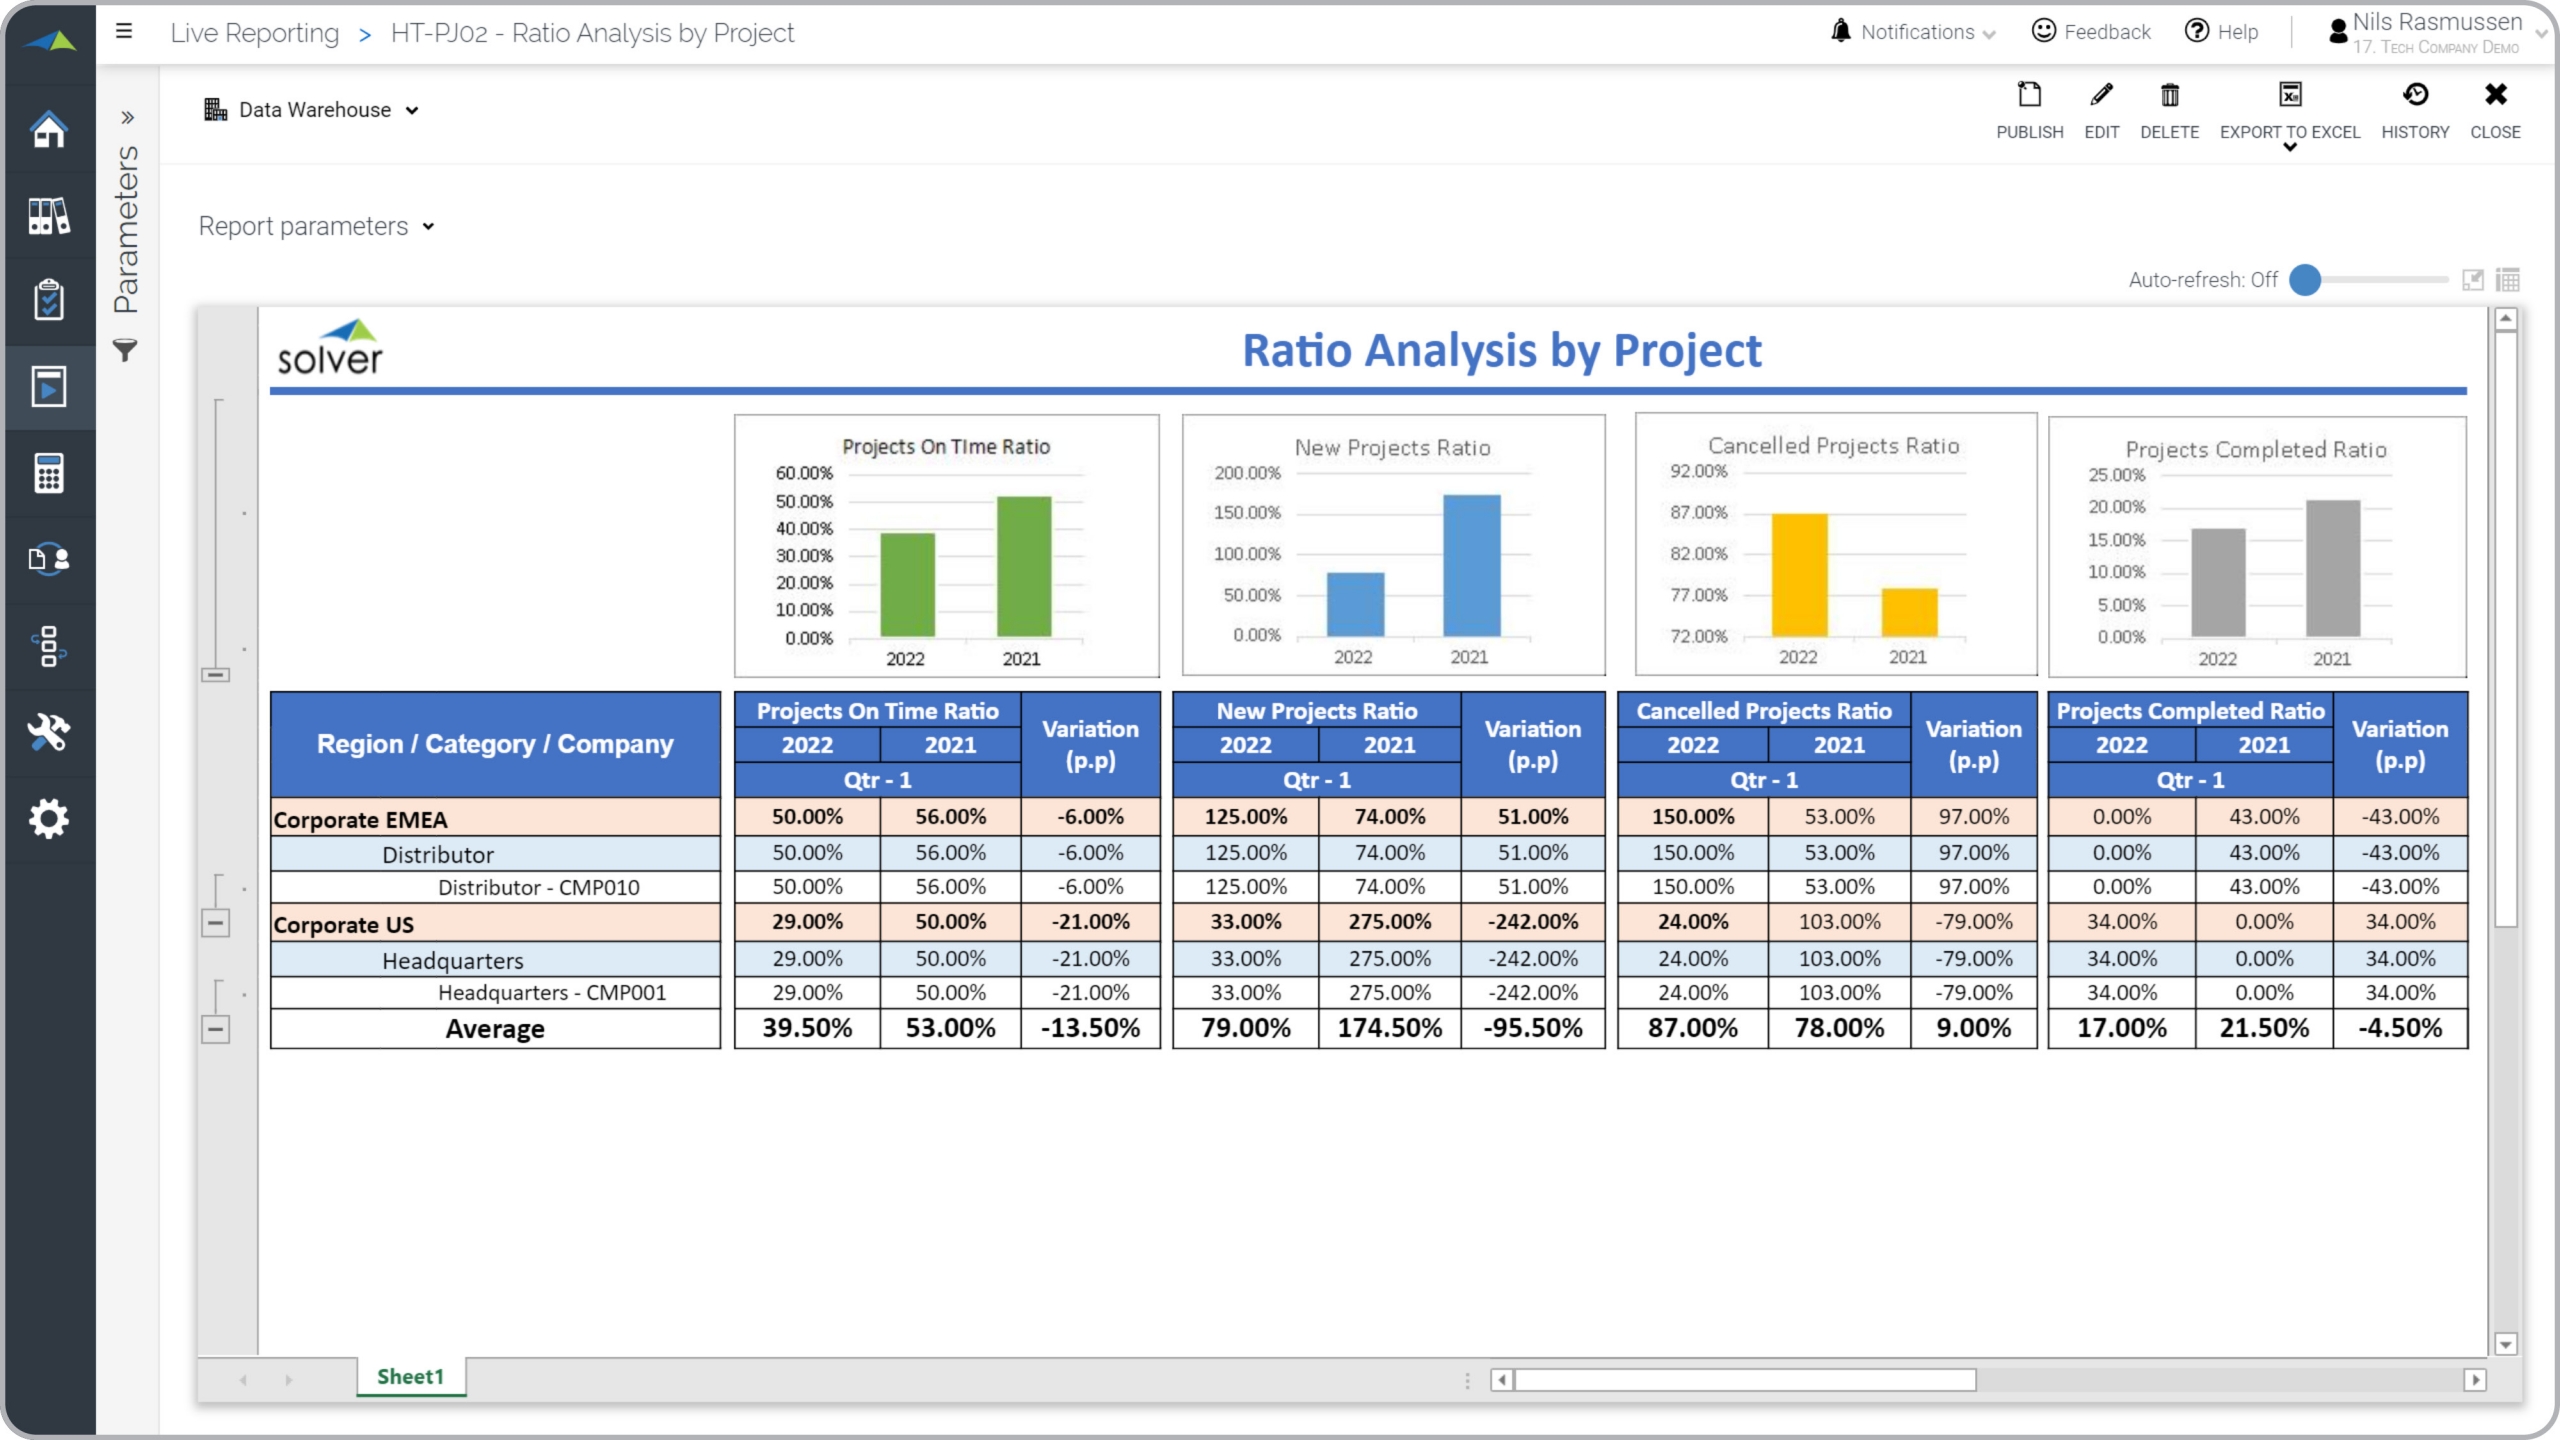
Tech – Project Status Analysis
It provides a year-over-year comparison of four metrics, including charts.
$
Planning
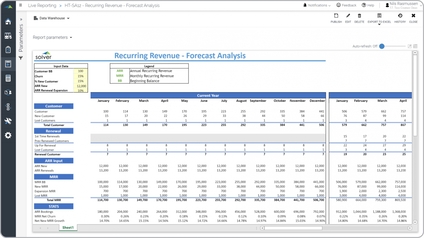
Tech – Recurring Revenue Forecast
Some of the key functionality model is that it can both be used to create forecasts and budgets, and it can be used for what-if modelling without storing the resulting data.
$