
Working Capital Trend Analysis
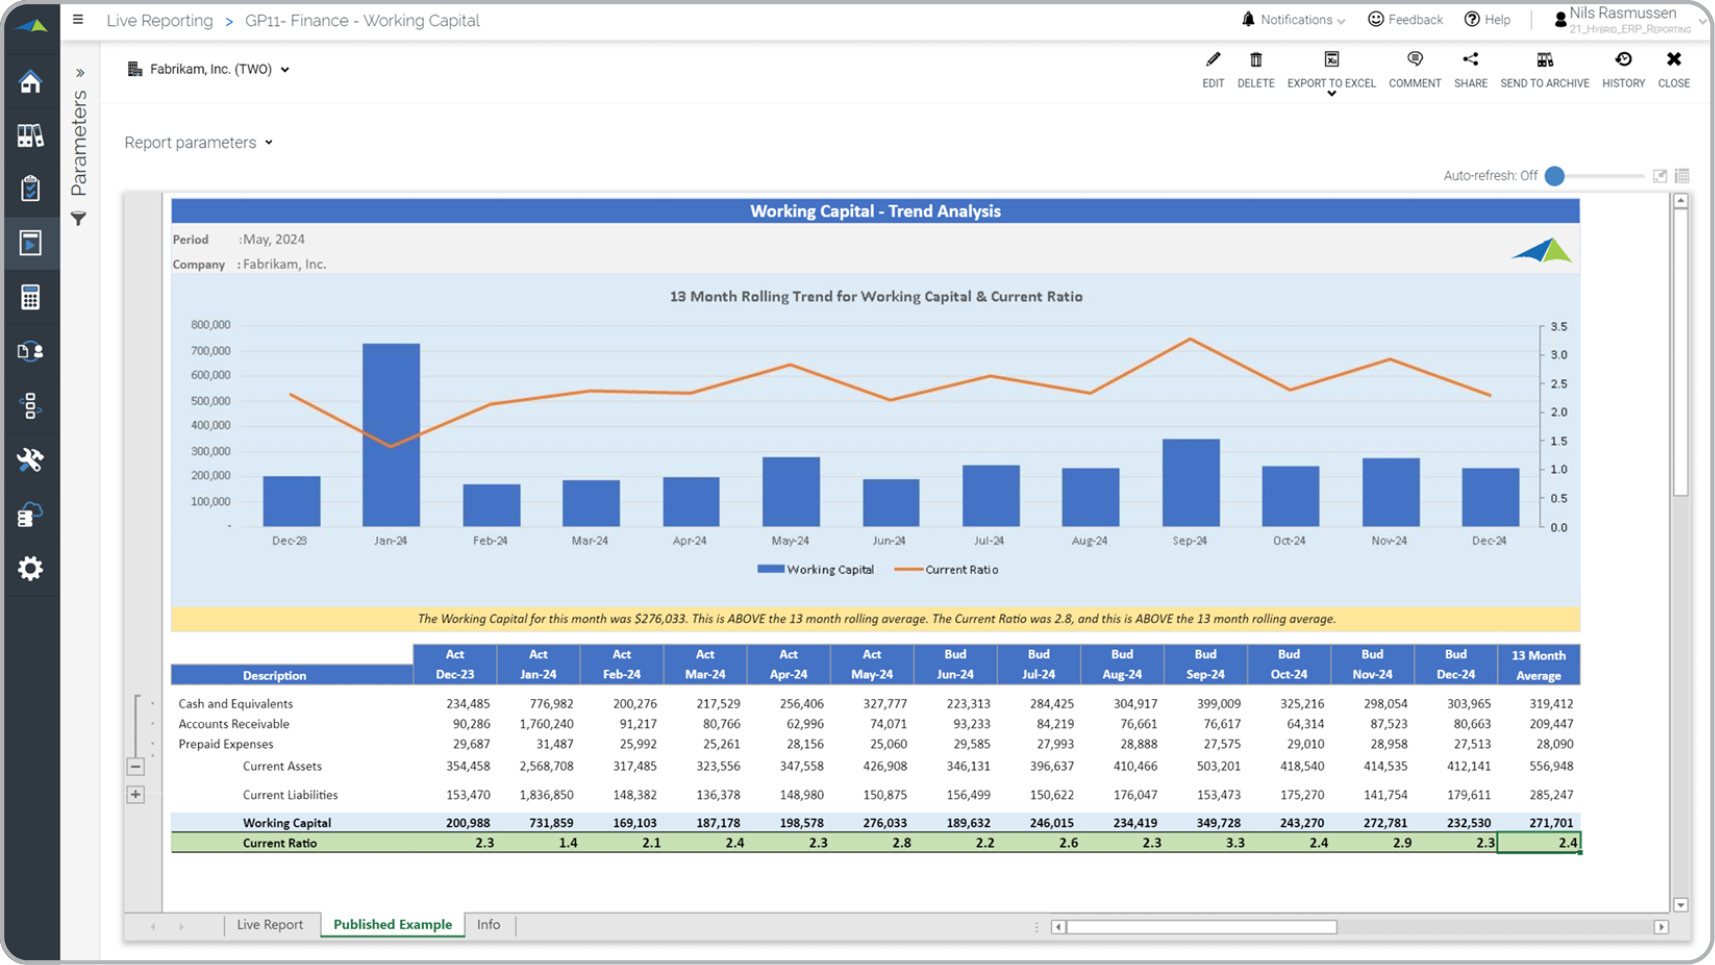
What is a Working Capital Trend Analysis Report? Working Capital trend reports are considered important liquidity analysis tools and are often used by CFOs and analysts to determine the company's ability to pay for short term obligations. Some of the key functionality in this type of report is that it dynamically displays data from the past 13 months. The chart on the top of the report gives a clear idea of the historical trend in Working Capital (left axis) and the Current Ratio (right axis). The rows displays Current Assets and Current Liabilities and the Total rows are expandable so the user can see the detailed accounts or categories behind the totals. The last row calculates the Current Ratio. The orange row displays an automatically generated narrative about the current liquidity situation. You find an example of this type of report below.
Purpose of Working Capital Trend Reports Companies and organizations use Working Capital Trend Reports to monitor the monthly swings in current assets and liabilities. When used as part of good business practices in a Financial Planning & Analysis (FP&A) department, a company can improve its liquidity as well as reduce the chances that issues arise because managers did not keep an eye on the company's ability to pay for current obligations.
Who Uses This Type of Report? The typical users of this type of report are: CFOs, Analysts, Treasurers and Controllers. Other Reports Often Used in Conjunction with Working Capital Trend Reports Progressive Financial Planning & Analysis (FP&A) Departments sometimes use several different Working Capital Trend Reports, along with trended financial statements, accounts receivable (AR) aging reports, monthly cash flow-, balance sheet- and income statements, liquidity dashboards, cash flow forecasts and other management and control tools.
Where Does the Data for Analysis Originate From? The Actual (historical transactions) data typically comes from enterprise resource planning (ERP) systems. In analyses where budgets or forecasts are used, the planning data most often originates from in-house Excel spreadsheet models or from professional xFP&A solutions.
This Solver report template connects directly to your ERP data via the Solver Data Warehouse, enabling near real-time analysis with minimal setup. Designed for QuickStart deployment, it can be activated rapidly so your team can focus on analysis and decisions — not data preparation.
What is the Working Capital Trend Analysis in Solver? The Working Capital Trend Analysis is a pre-built xFP&A report template in Solver that delivers key financial and operational metrics in a single, easy-to-use interface, eliminating the need for manual data work or custom report development.
Who uses this Solver report template? This template is primarily used by CFOs, FP&A managers, and controllers who need accurate, timely reporting without manual data preparation. It is also valuable for department heads and business unit leaders who need periodic performance summaries.
Where does the data come from? Data is sourced automatically from your ERP system through the Solver Data Warehouse. Once connected, the template updates in near real-time with no manual data entry required.
To learn more, visit the Resource Library.