

Solver-markedet
Utforsk etter funksjonalitet (rapporter, planlegging og dashbordmaler), eller bruk søkefunksjonen til å filtrere etter integrasjon, bransje eller for å finne en mal som passer dine spesifikke behov. Lagre maler i favorittlisten din, og bruk lenken «Del favoritter» for å dele listen med andre.
Ikonforklaring:
💲 Krever konsulenttimer for å sette opp og konfigurere
⭐ Lagre som favoritt og del med andre
FUNCTIONALITY
- Reports
- Planning
- Dashboard
Data Source
Marketplace Data Source: Filter by Data Source to find assets specific to your system
Showcase Data Source: Filter by Data Source to find assets specific to your system
Industries
Marketplace Industries: Filter by Industries to find assets specific to your system
Showcase Industries: Filter by Industries to find assets specific to your system
industries
Marketplace Industries: Filter by your industry to find assets created for your specific needs
Showcase Industries: Filter by your industry to find assets created for your specific needs
523 - 528 of 868 Results
Favorite Page Results
Favorites


Planning
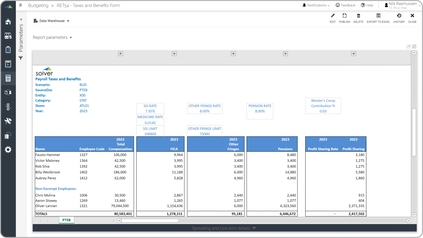
Retail – Employee Taxes and Benefits
Employee Tax and Benefit budgets are considered an important component of a budget model and are often used by retail chains and store managers to estimate detailed staff-related expenses for the budget.
$
Reports
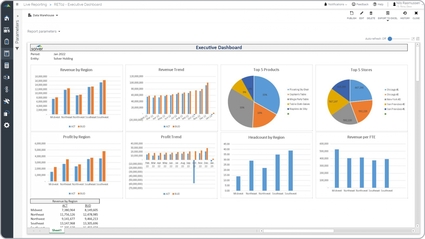
Retail – Executive Dashboard
It can be viewed for any period and retail entity. It contains eight charts that provides analysis of revenue, profit and headcount.
$
Planning
Reports
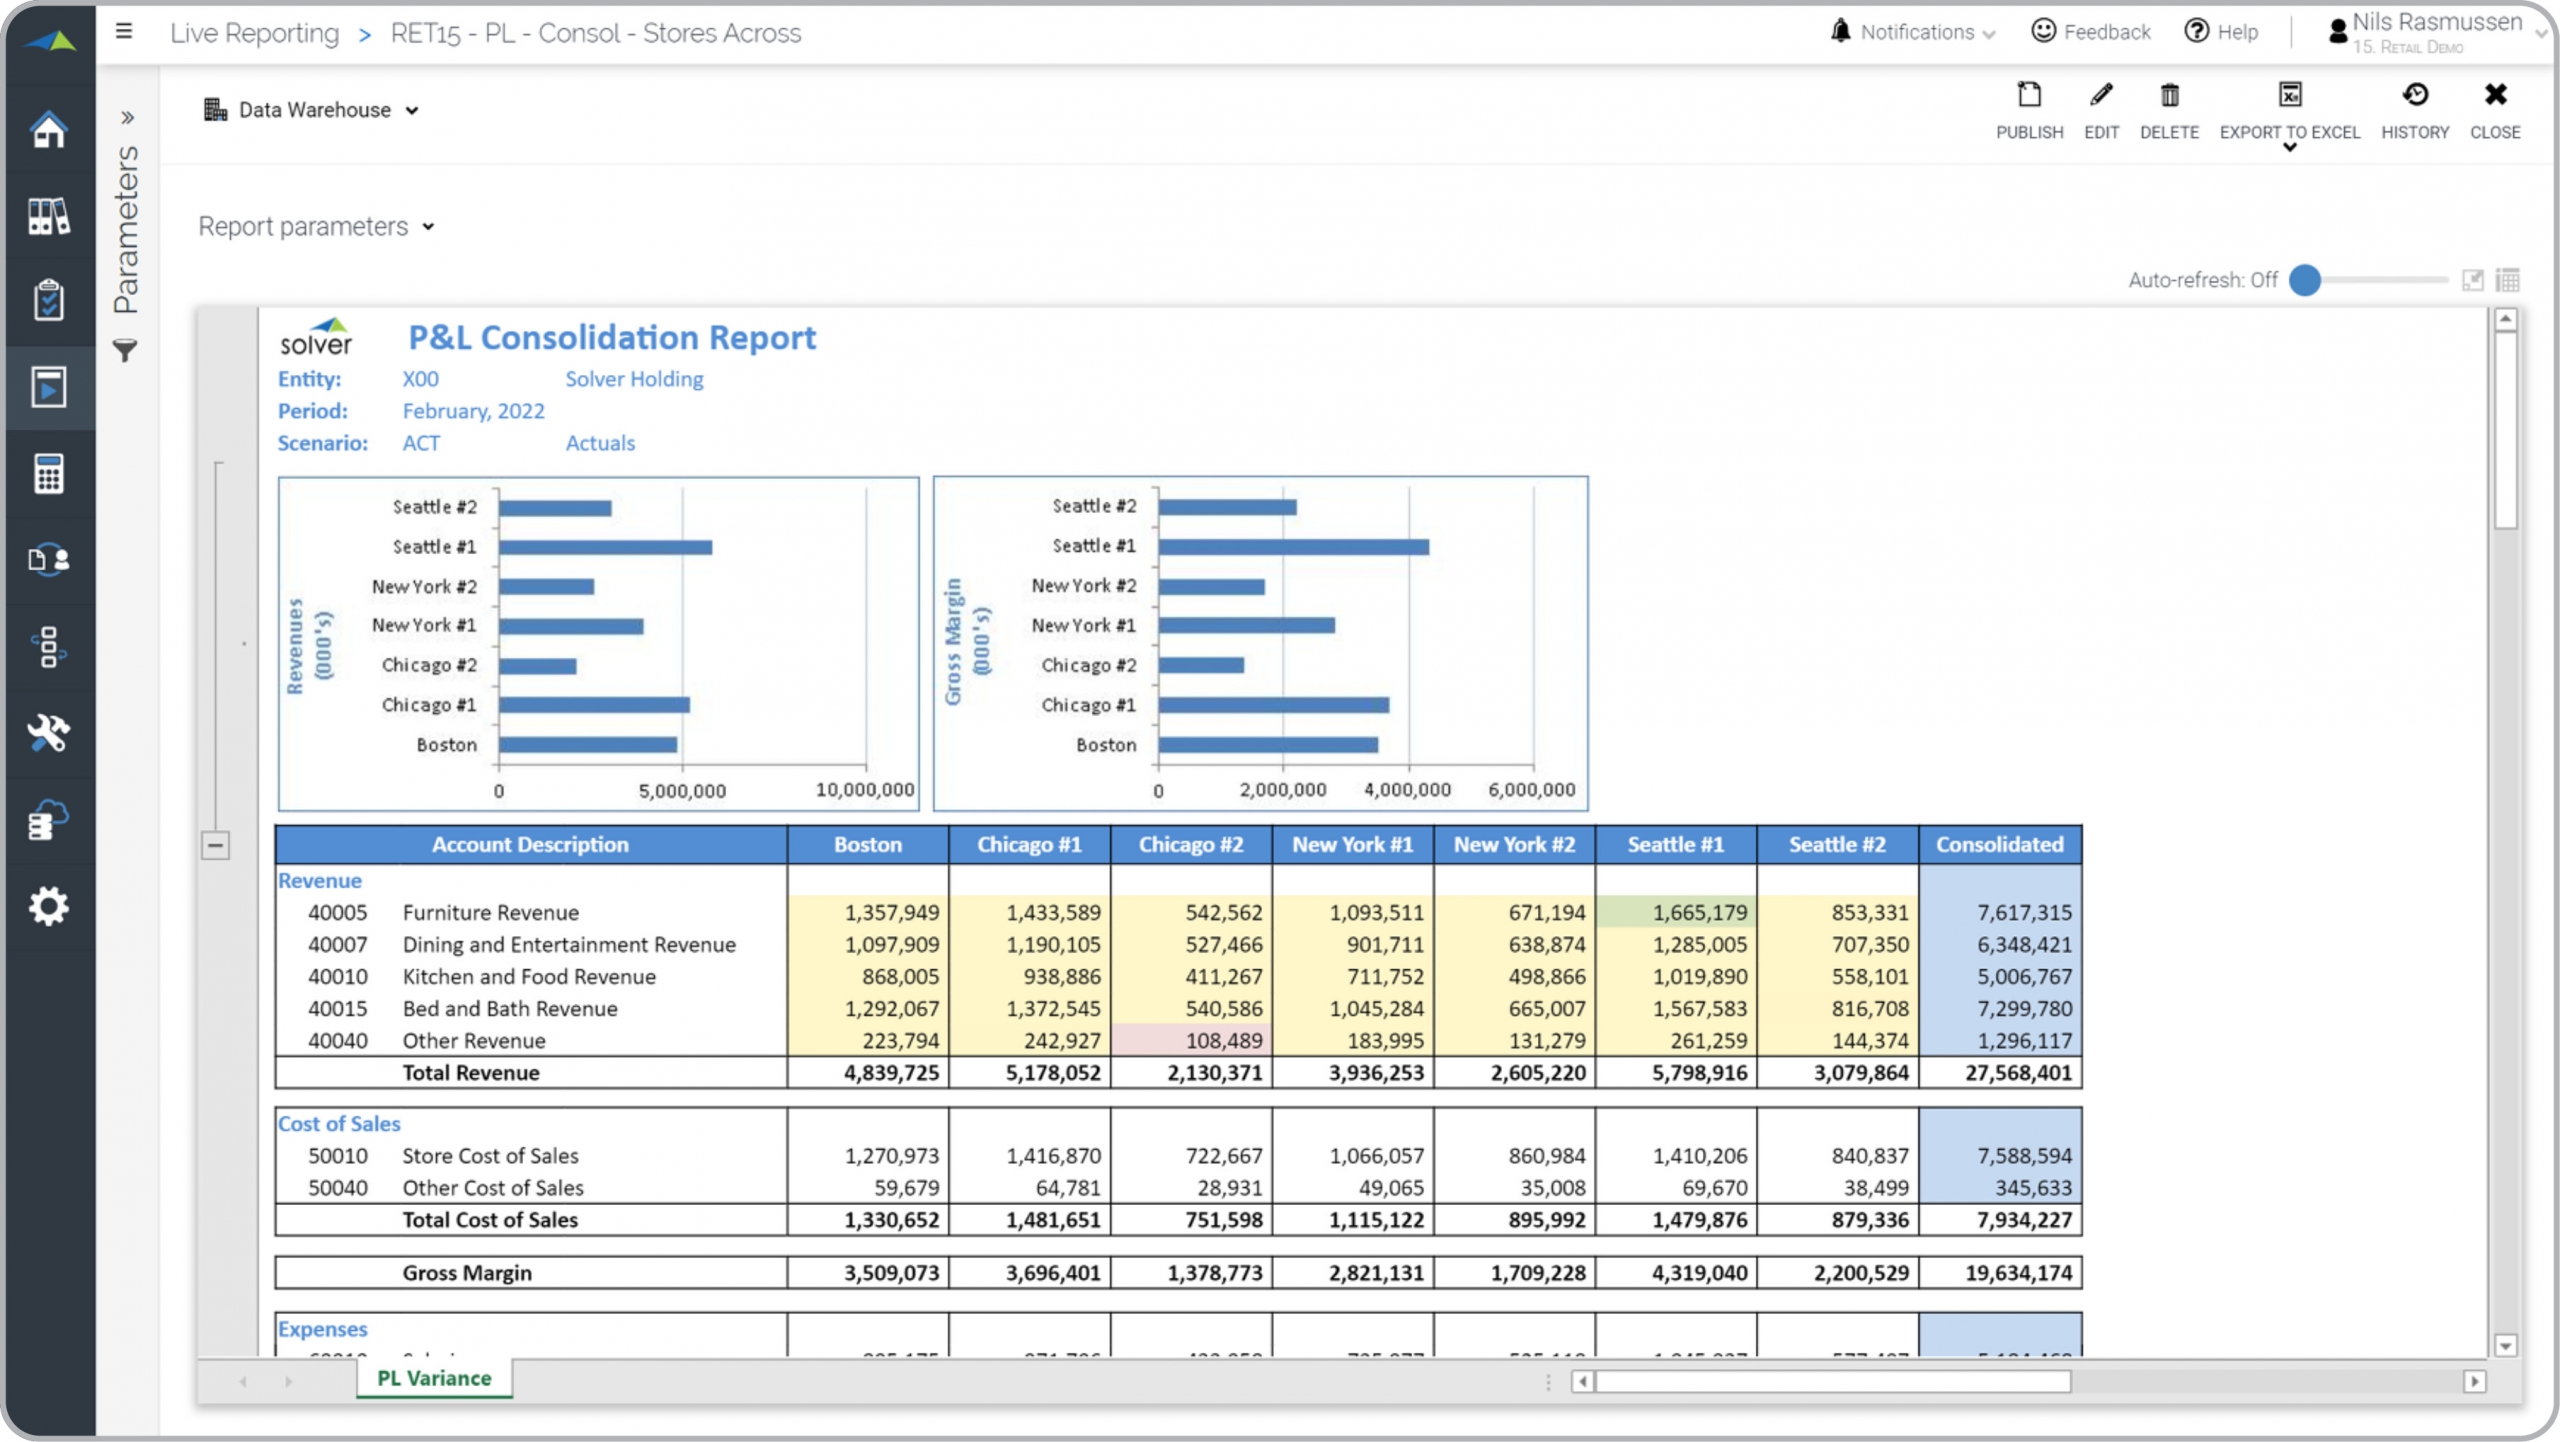
Retail – P&L Consolidation Report
It dynamically lists selected stores or regions across the columns with a consolidated total. The charts on the top of the reports provides easy comparisons.
$
Reports
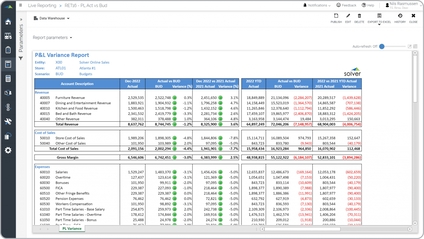
Retail – P&L Variance Report
Profit & Loss (P&L) It is a dynamic, web-based report where users pick the month and entity to run the report for.
$
Dashboard
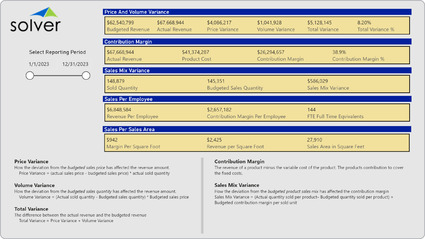
Retail – Price and Volume Variance
It gives the user KPIs that cover five different areas:. Price and volume variance,. Contribution margin,.
$