

Solver-markedet
Utforsk etter funksjonalitet (rapporter, planlegging og dashbordmaler), eller bruk søkefunksjonen til å filtrere etter integrasjon, bransje eller for å finne en mal som passer dine spesifikke behov. Lagre maler i favorittlisten din, og bruk lenken «Del favoritter» for å dele listen med andre.
Ikonforklaring:
💲 Krever konsulenttimer for å sette opp og konfigurere
⭐ Lagre som favoritt og del med andre
FUNCTIONALITY
- Reports
- Planning
- Dashboard
Data Source
Marketplace Data Source: Filter by Data Source to find assets specific to your system
Showcase Data Source: Filter by Data Source to find assets specific to your system
Industries
Marketplace Industries: Filter by Industries to find assets specific to your system
Showcase Industries: Filter by Industries to find assets specific to your system
industries
Marketplace Industries: Filter by your industry to find assets created for your specific needs
Showcase Industries: Filter by your industry to find assets created for your specific needs
427 - 432 of 868 Results
Favorite Page Results
Favorites


Dashboard
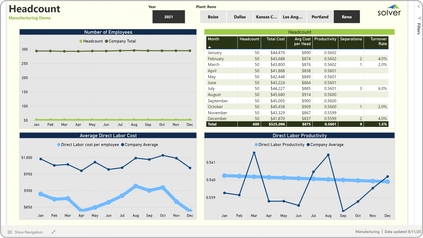
Mfg – Personnel Cost and Productivity
It gives the user four angles of analysis, including:. Plant headcount and total headcount - monthly trend,.
$
Planning
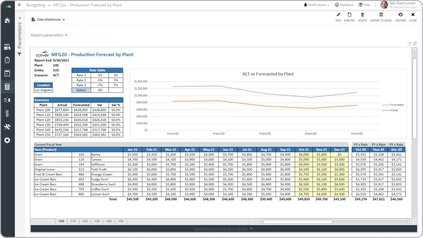
Mfg – Production Forecast per Plant
Key functionality template automatically displays actual amounts by item for the year-to-date periods. These figures are driven from price and quantity figures. Each tab in the template represents a different plant.
$
Reports
Dashboard
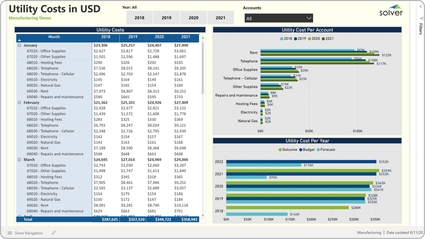
Mfg – Utility Cost Analysis
It compares expenses over months, years and GL accounts. Utility cost metrics by GL account by month over the last four years,.
$
Reports
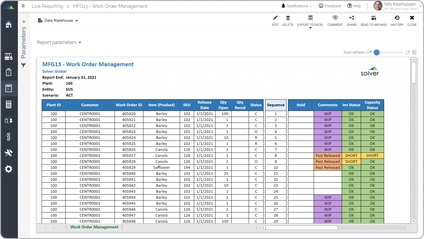
Mfg – Work Order Management
It shows work orders by plant, customer and item. It also displays production sequence, inventory and capacity statuses.
$
Dashboard
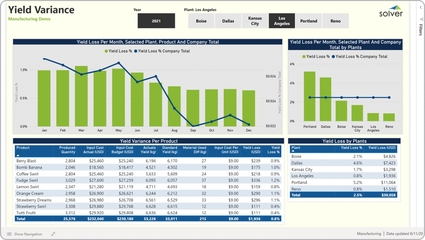
Mfg – Yield Analysis
It provides yield loss and variance analysis from four different perspectives. Monthly trend in yield loss for selected plant and for the company total,.
$