

Solver-markedet
Utforsk etter funksjonalitet (rapporter, planlegging og dashbordmaler), eller bruk søkefunksjonen til å filtrere etter integrasjon, bransje eller for å finne en mal som passer dine spesifikke behov. Lagre maler i favorittlisten din, og bruk lenken «Del favoritter» for å dele listen med andre.
Ikonforklaring:
💲 Krever konsulenttimer for å sette opp og konfigurere
⭐ Lagre som favoritt og del med andre
FUNCTIONALITY
- Reports
- Planning
- Dashboard
Data Source
Marketplace Data Source: Filter by Data Source to find assets specific to your system
Showcase Data Source: Filter by Data Source to find assets specific to your system
Industries
Marketplace Industries: Filter by Industries to find assets specific to your system
Showcase Industries: Filter by Industries to find assets specific to your system
industries
Marketplace Industries: Filter by your industry to find assets created for your specific needs
Showcase Industries: Filter by your industry to find assets created for your specific needs
391 - 396 of 868 Results
Favorite Page Results
Favorites


Reports
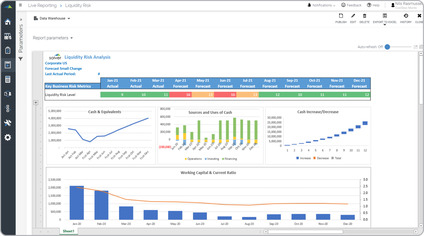
Liquidity Risk Forecast
A It allows the user to score the risk based on a weighted average of various drivers that comprise the overall liquidity risk number as seen in the image below. The user can find more details by expanding the section below the risk rating.
$
Planning
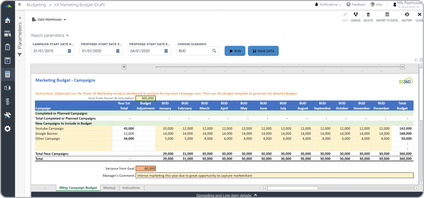
Marketing Budget
Marketing Budget models are considered to be a key component of an annual budget and are used by marketing managers to estimate expenses and marketing campaign schedules.
$
Reports
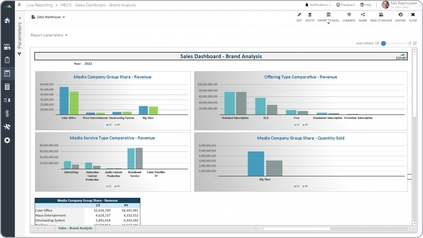
Media – Brand Sales Analysis
It displays metrics graphically from for different perspectives:. Current year (CY) versus prior year (PY) revenue by company,. CY versus PY revenue by media service,.
$
Reports
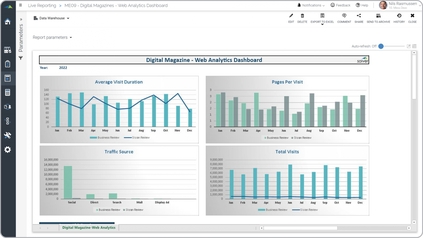
Media – Digital Magazine Analysis
It provides monthly trend analysis per online publication. The example has four different perspectives.
$
Reports
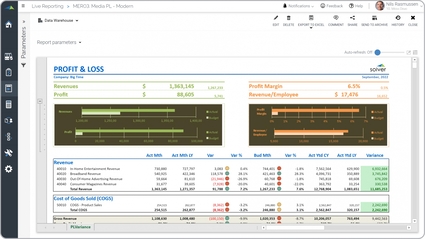
Media – Monthly Profit & Loss Report
It is combines charts and a typical P&L layout with dynamic rows that automatically includes new general ledger (GL) accounts.
$
Reports
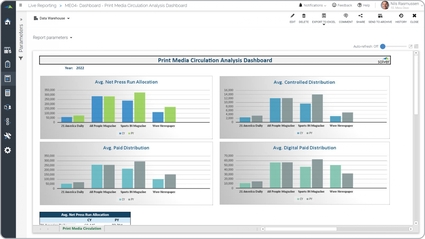
Media – Print Media Circulation Analysis
It displays KPIs from four different perspectives:. Current year (CY) and Prior year (CY) Press Run metrics by publication,. CY versus PY average paid distribution by publication,.
$