

Solver-markedet
Utforsk etter funksjonalitet (rapporter, planlegging og dashbordmaler), eller bruk søkefunksjonen til å filtrere etter integrasjon, bransje eller for å finne en mal som passer dine spesifikke behov. Lagre maler i favorittlisten din, og bruk lenken «Del favoritter» for å dele listen med andre.
Ikonforklaring:
💲 Krever konsulenttimer for å sette opp og konfigurere
⭐ Lagre som favoritt og del med andre
FUNCTIONALITY
- Reports
- Planning
- Dashboard
Data Source
Marketplace Data Source: Filter by Data Source to find assets specific to your system
Showcase Data Source: Filter by Data Source to find assets specific to your system
Industries
Marketplace Industries: Filter by Industries to find assets specific to your system
Showcase Industries: Filter by Industries to find assets specific to your system
industries
Marketplace Industries: Filter by your industry to find assets created for your specific needs
Showcase Industries: Filter by your industry to find assets created for your specific needs
175 - 180 of 868 Results
Favorite Page Results
Favorites
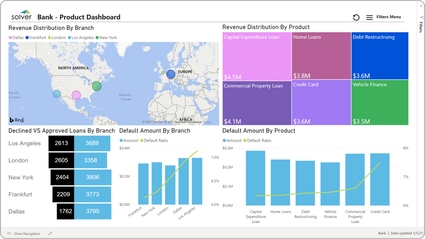


Dashboard
Reports
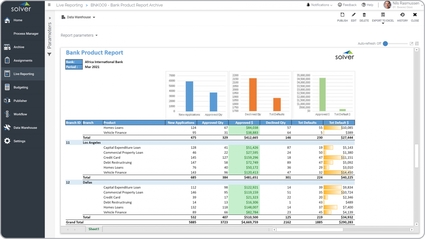
Bank – Product Report
Some of the main functionality KPI report is that it can be filtered by any region and period, and it provides both detailed and summarized figures. The three charts on the top of the report show.
$
Reports
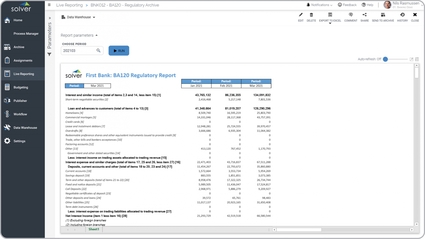
Bank – Regulatory Report
Some of the main functionality compliance report is that it is a standard format that populates automatically based on the period. It dynamically expands months across the columns based on the period you run the report for.
$
Dashboard
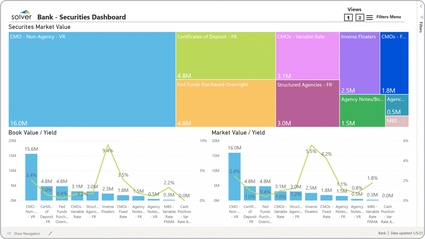
Bank – Securities Dashboard
It track performance metrics from three different perspectives, including.
$
Reports
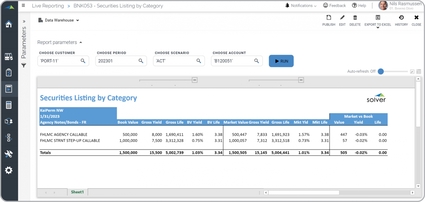
Bank – Securities Listing by Category
It is parameter driven and for any select group of securities it displays book- and market values as well as variances between these.
$
Reports
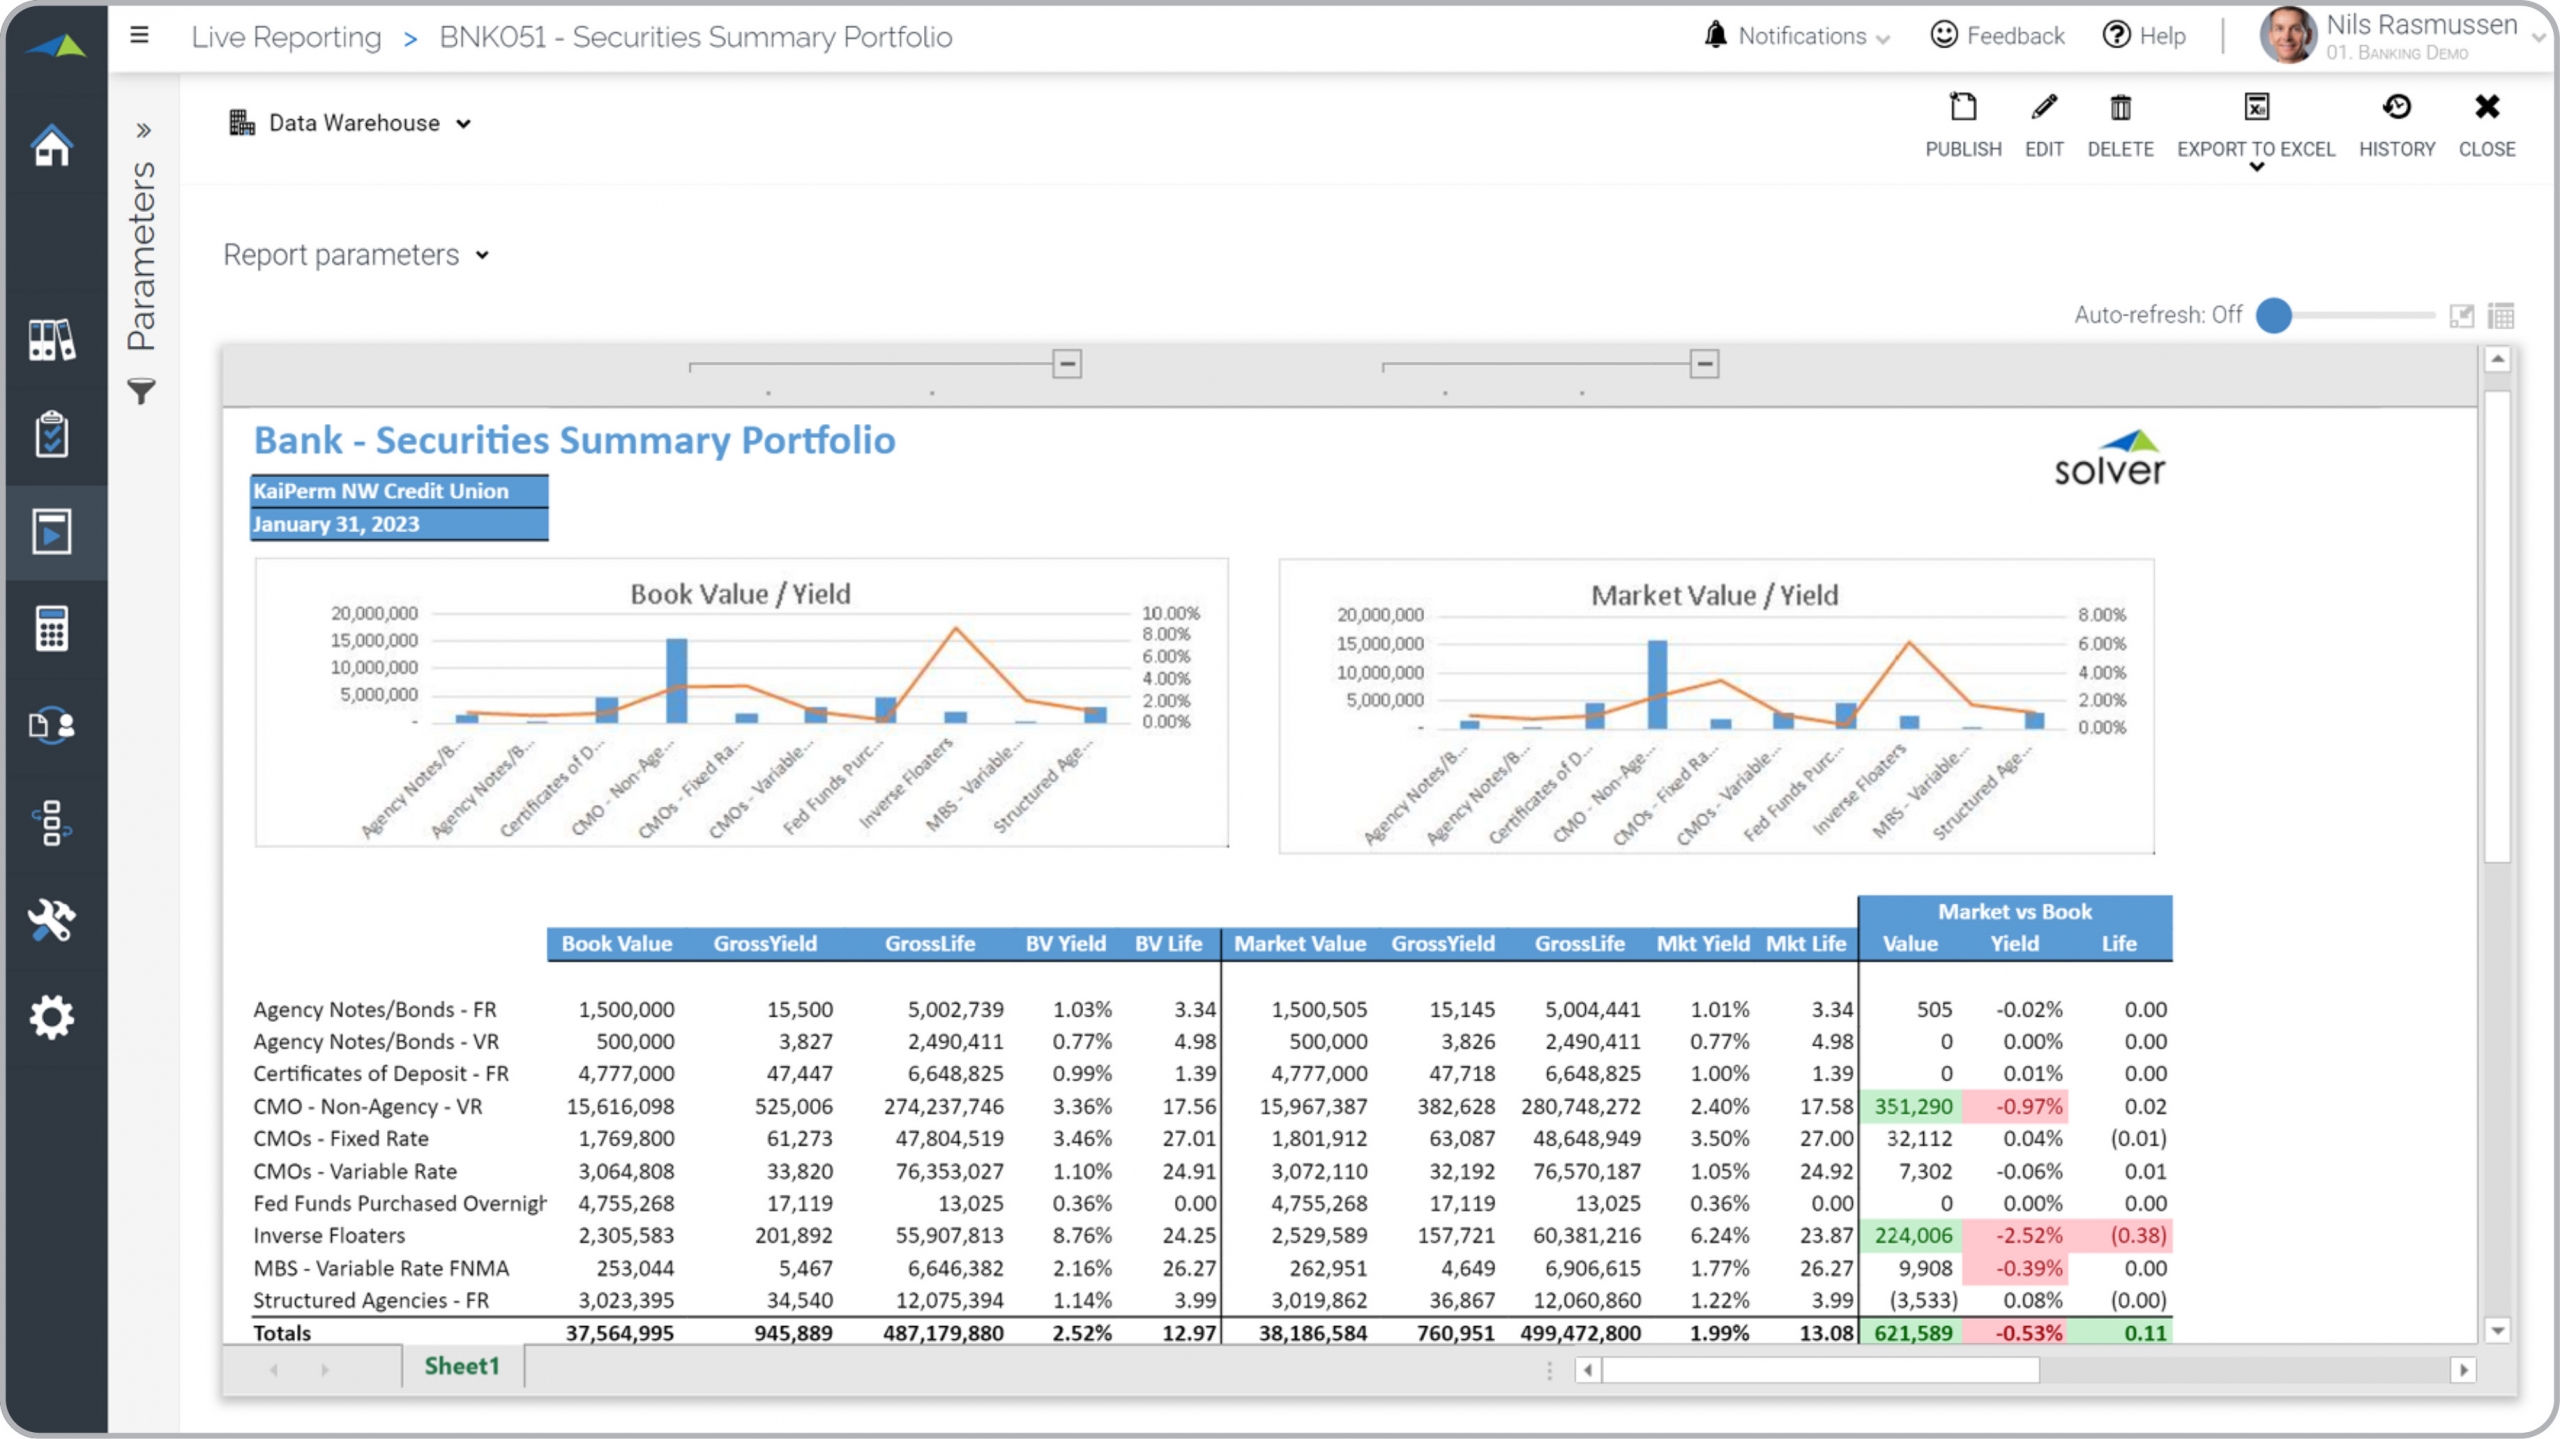
Bank – Securities Summary Portfolio
It combines charts, figures and exception highlighting to optimize analysis.
$