

Solver-markedet
Utforsk etter funksjonalitet (rapporter, planlegging og dashbordmaler), eller bruk søkefunksjonen til å filtrere etter integrasjon, bransje eller for å finne en mal som passer dine spesifikke behov. Lagre maler i favorittlisten din, og bruk lenken «Del favoritter» for å dele listen med andre.
Ikonforklaring:
💲 Krever konsulenttimer for å sette opp og konfigurere
⭐ Lagre som favoritt og del med andre
FUNCTIONALITY
- Reports
- Planning
- Dashboard
Data Source
Marketplace Data Source: Filter by Data Source to find assets specific to your system
Showcase Data Source: Filter by Data Source to find assets specific to your system
Industries
Marketplace Industries: Filter by Industries to find assets specific to your system
Showcase Industries: Filter by Industries to find assets specific to your system
industries
Marketplace Industries: Filter by your industry to find assets created for your specific needs
Showcase Industries: Filter by your industry to find assets created for your specific needs
661 - 666 of 868 Results
Favorite Page Results
Favorites


Reports
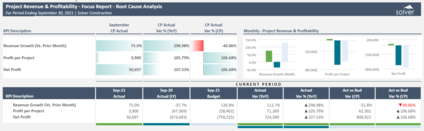
Construction - KPI - Focus Report - Project Revenue & Profitability
Analyzes project revenue and profitability against contract value and budget. Enables construction project managers and CFOs to monitor margin health and take corrective action.
$
Reports
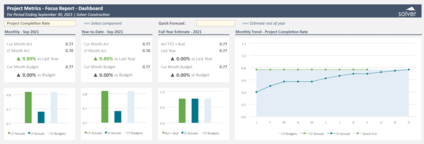
Construction - KPI - Focus Report - Project Metrics
Tracks key project performance metrics including percent complete, burn rate, and remaining budget versus estimate. Helps construction teams manage project health and delivery timelines.
$
Reports
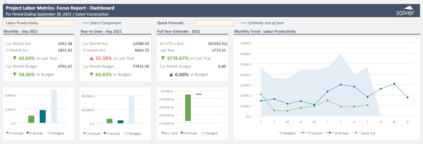
Construction - KPI - Focus Report - Project Labor Metrics
Analyzes labor hours, costs, and productivity by project and trade. Supports workforce planning and labor cost management across construction operations.
$
Reports
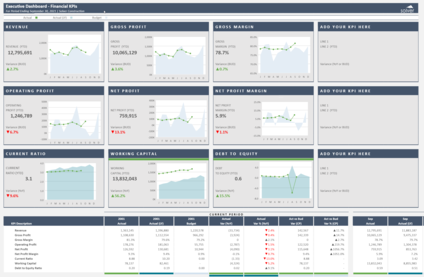
Construction - Dashboard Financial KPIs
Tile-style Power BI dashboard displaying key financial KPIs for construction executives including revenue, costs, and margin. Designed for clear, concise snapshot reporting.
$
Reports
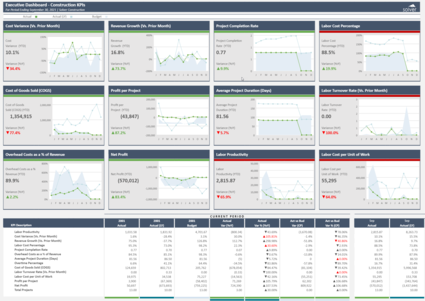
Construction - Dashboard - Construction KPIs
Displays construction-specific operational KPIs including project completion rates, labor productivity, and equipment utilization. Supports operational decision-making for project managers.
$
Reports
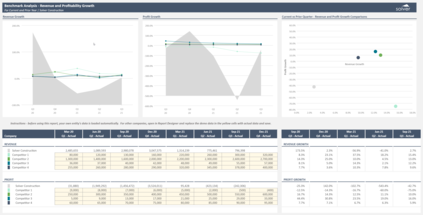
Construction - Dashboard Benchmark Analysis
Compares project financial and operational KPIs across the portfolio in a benchmark view. Helps construction executives identify top-performing projects and replicate best practices.
$