

Solver-markedet
Utforsk etter funksjonalitet (rapporter, planlegging og dashbordmaler), eller bruk søkefunksjonen til å filtrere etter integrasjon, bransje eller for å finne en mal som passer dine spesifikke behov. Lagre maler i favorittlisten din, og bruk lenken «Del favoritter» for å dele listen med andre.
Ikonforklaring:
💲 Krever konsulenttimer for å sette opp og konfigurere
⭐ Lagre som favoritt og del med andre
FUNCTIONALITY
- Reports
- Planning
- Dashboard
Data Source
Marketplace Data Source: Filter by Data Source to find assets specific to your system
Showcase Data Source: Filter by Data Source to find assets specific to your system
Industries
Marketplace Industries: Filter by Industries to find assets specific to your system
Showcase Industries: Filter by Industries to find assets specific to your system
industries
Marketplace Industries: Filter by your industry to find assets created for your specific needs
Showcase Industries: Filter by your industry to find assets created for your specific needs
55 - 60 of 868 Results
Favorite Page Results
Favorites
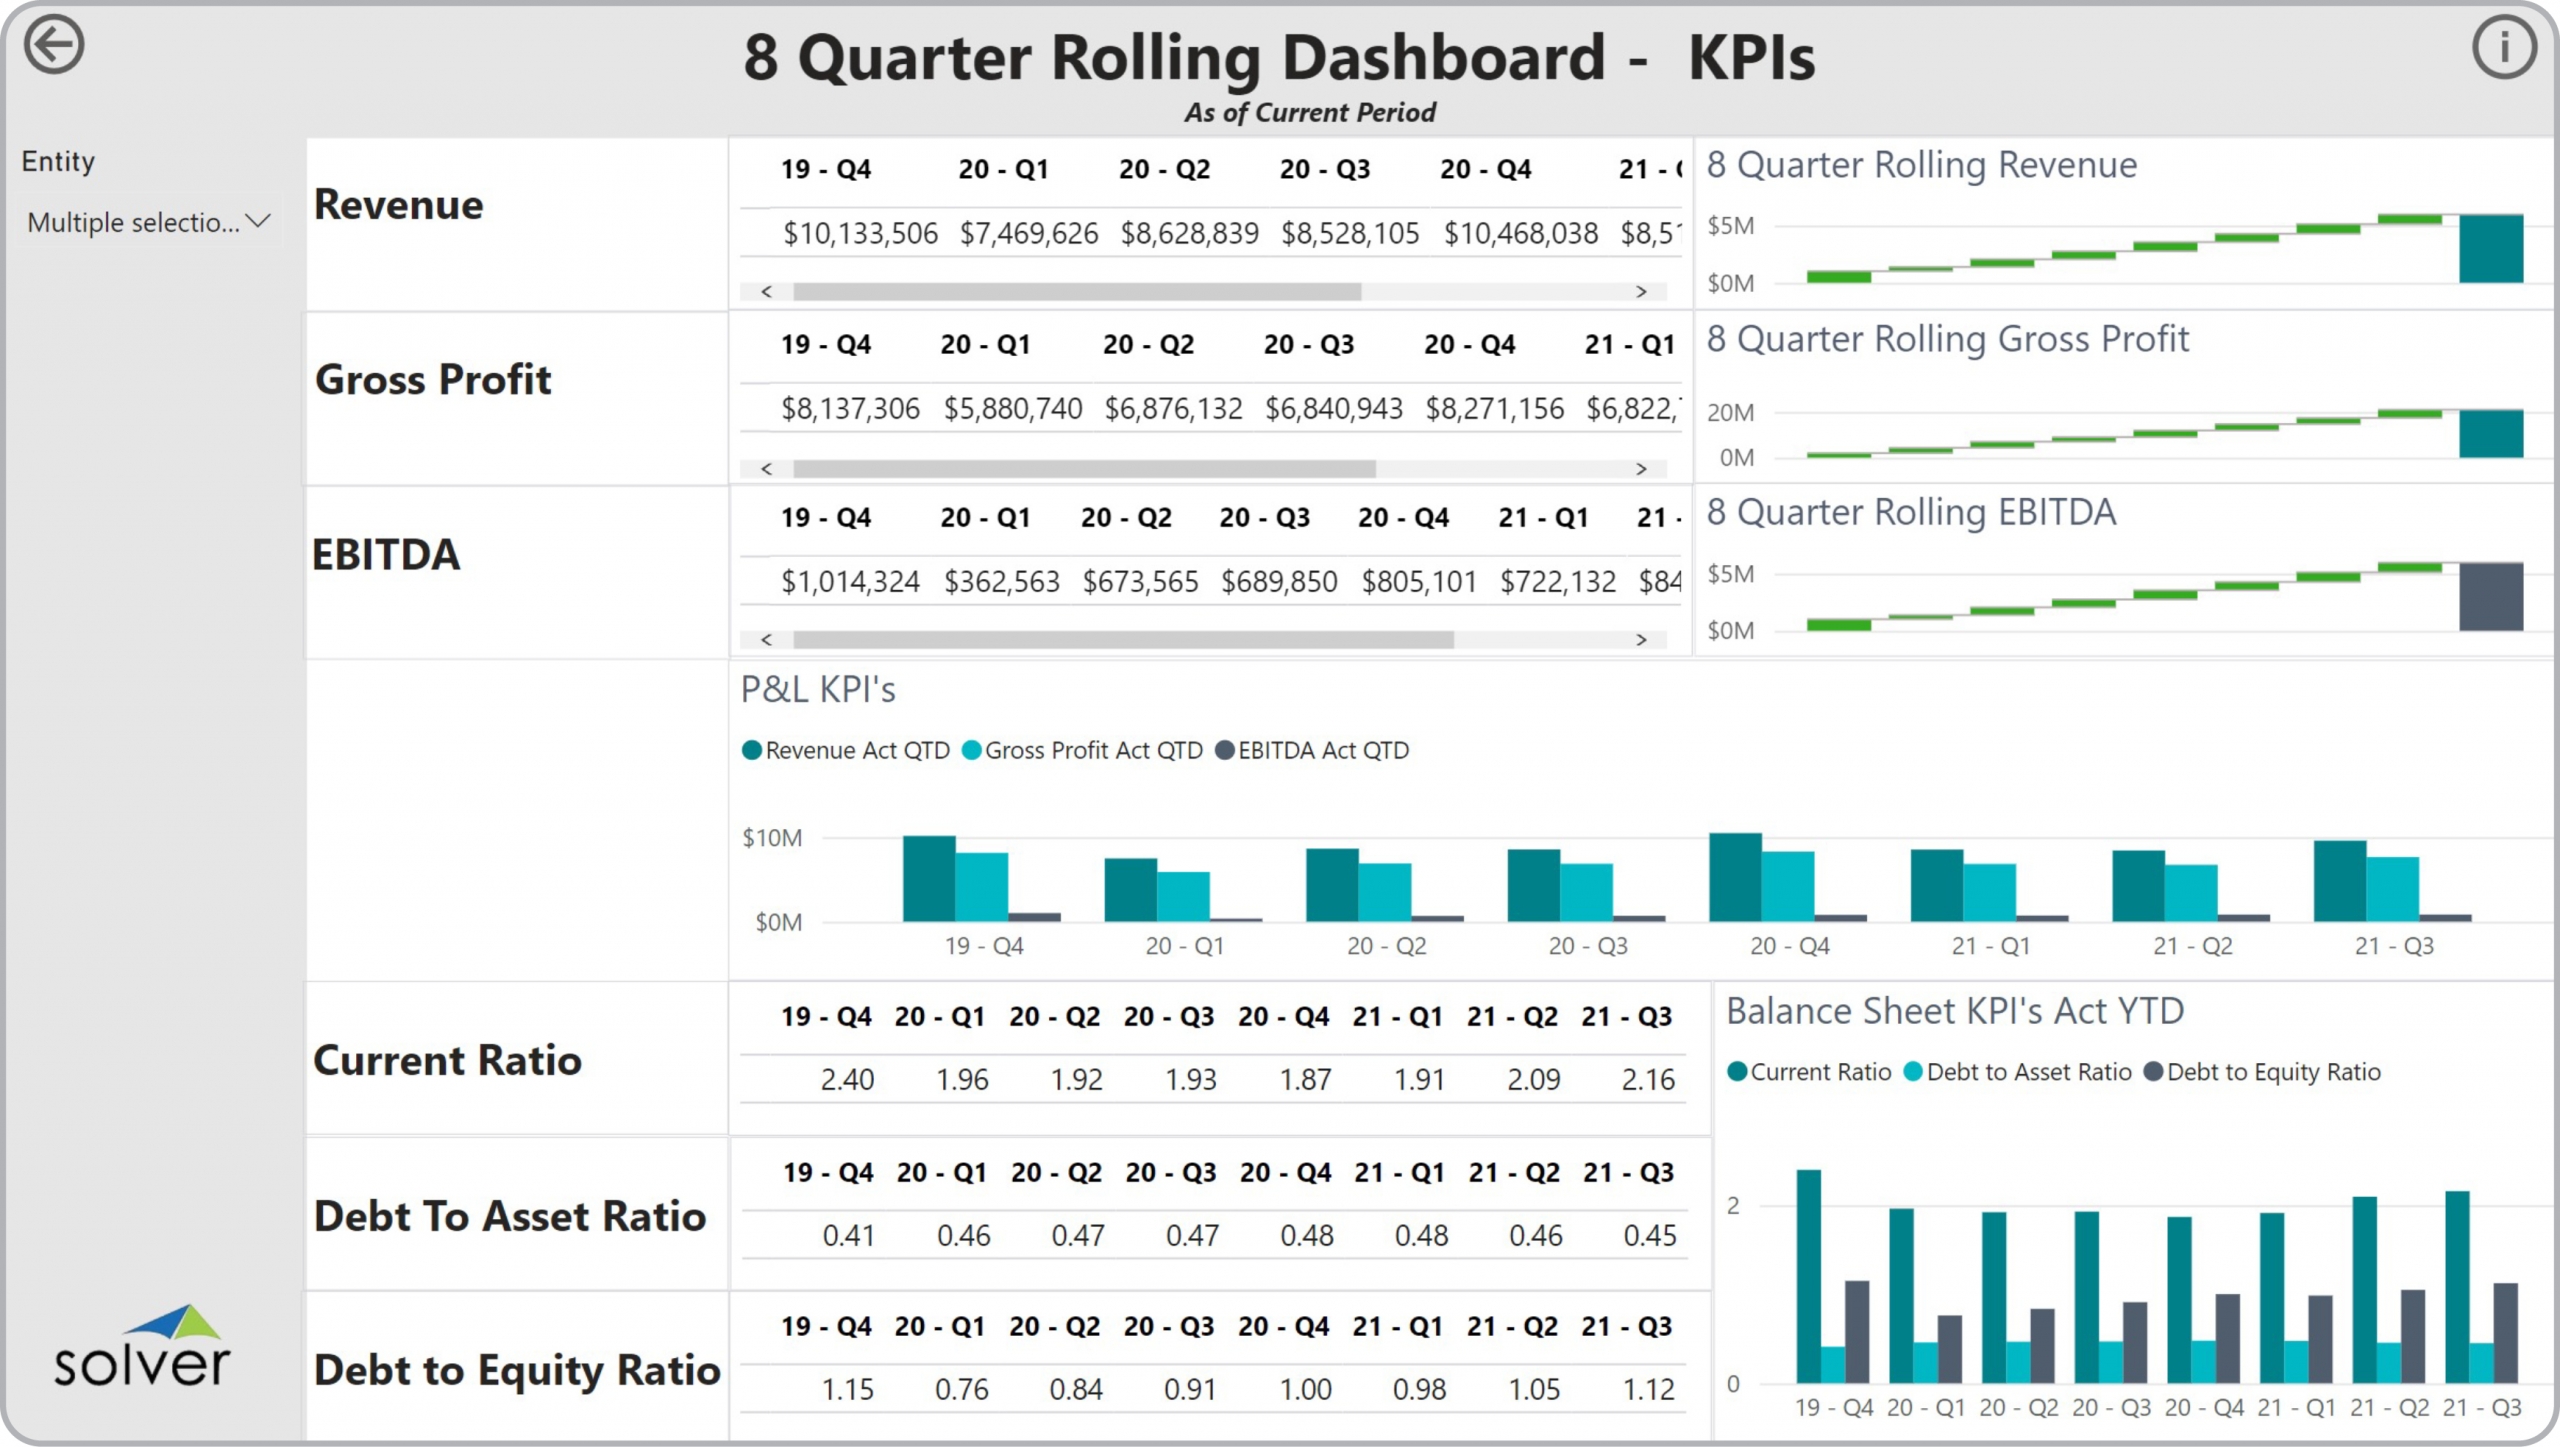


Dashboard
GL Dashboard – 8 Quarter KPI Trend
It gives CFOs, FP&A managers, and business unit leaders fast, reliable access to the financial and operational insights they need — without custom development.
$
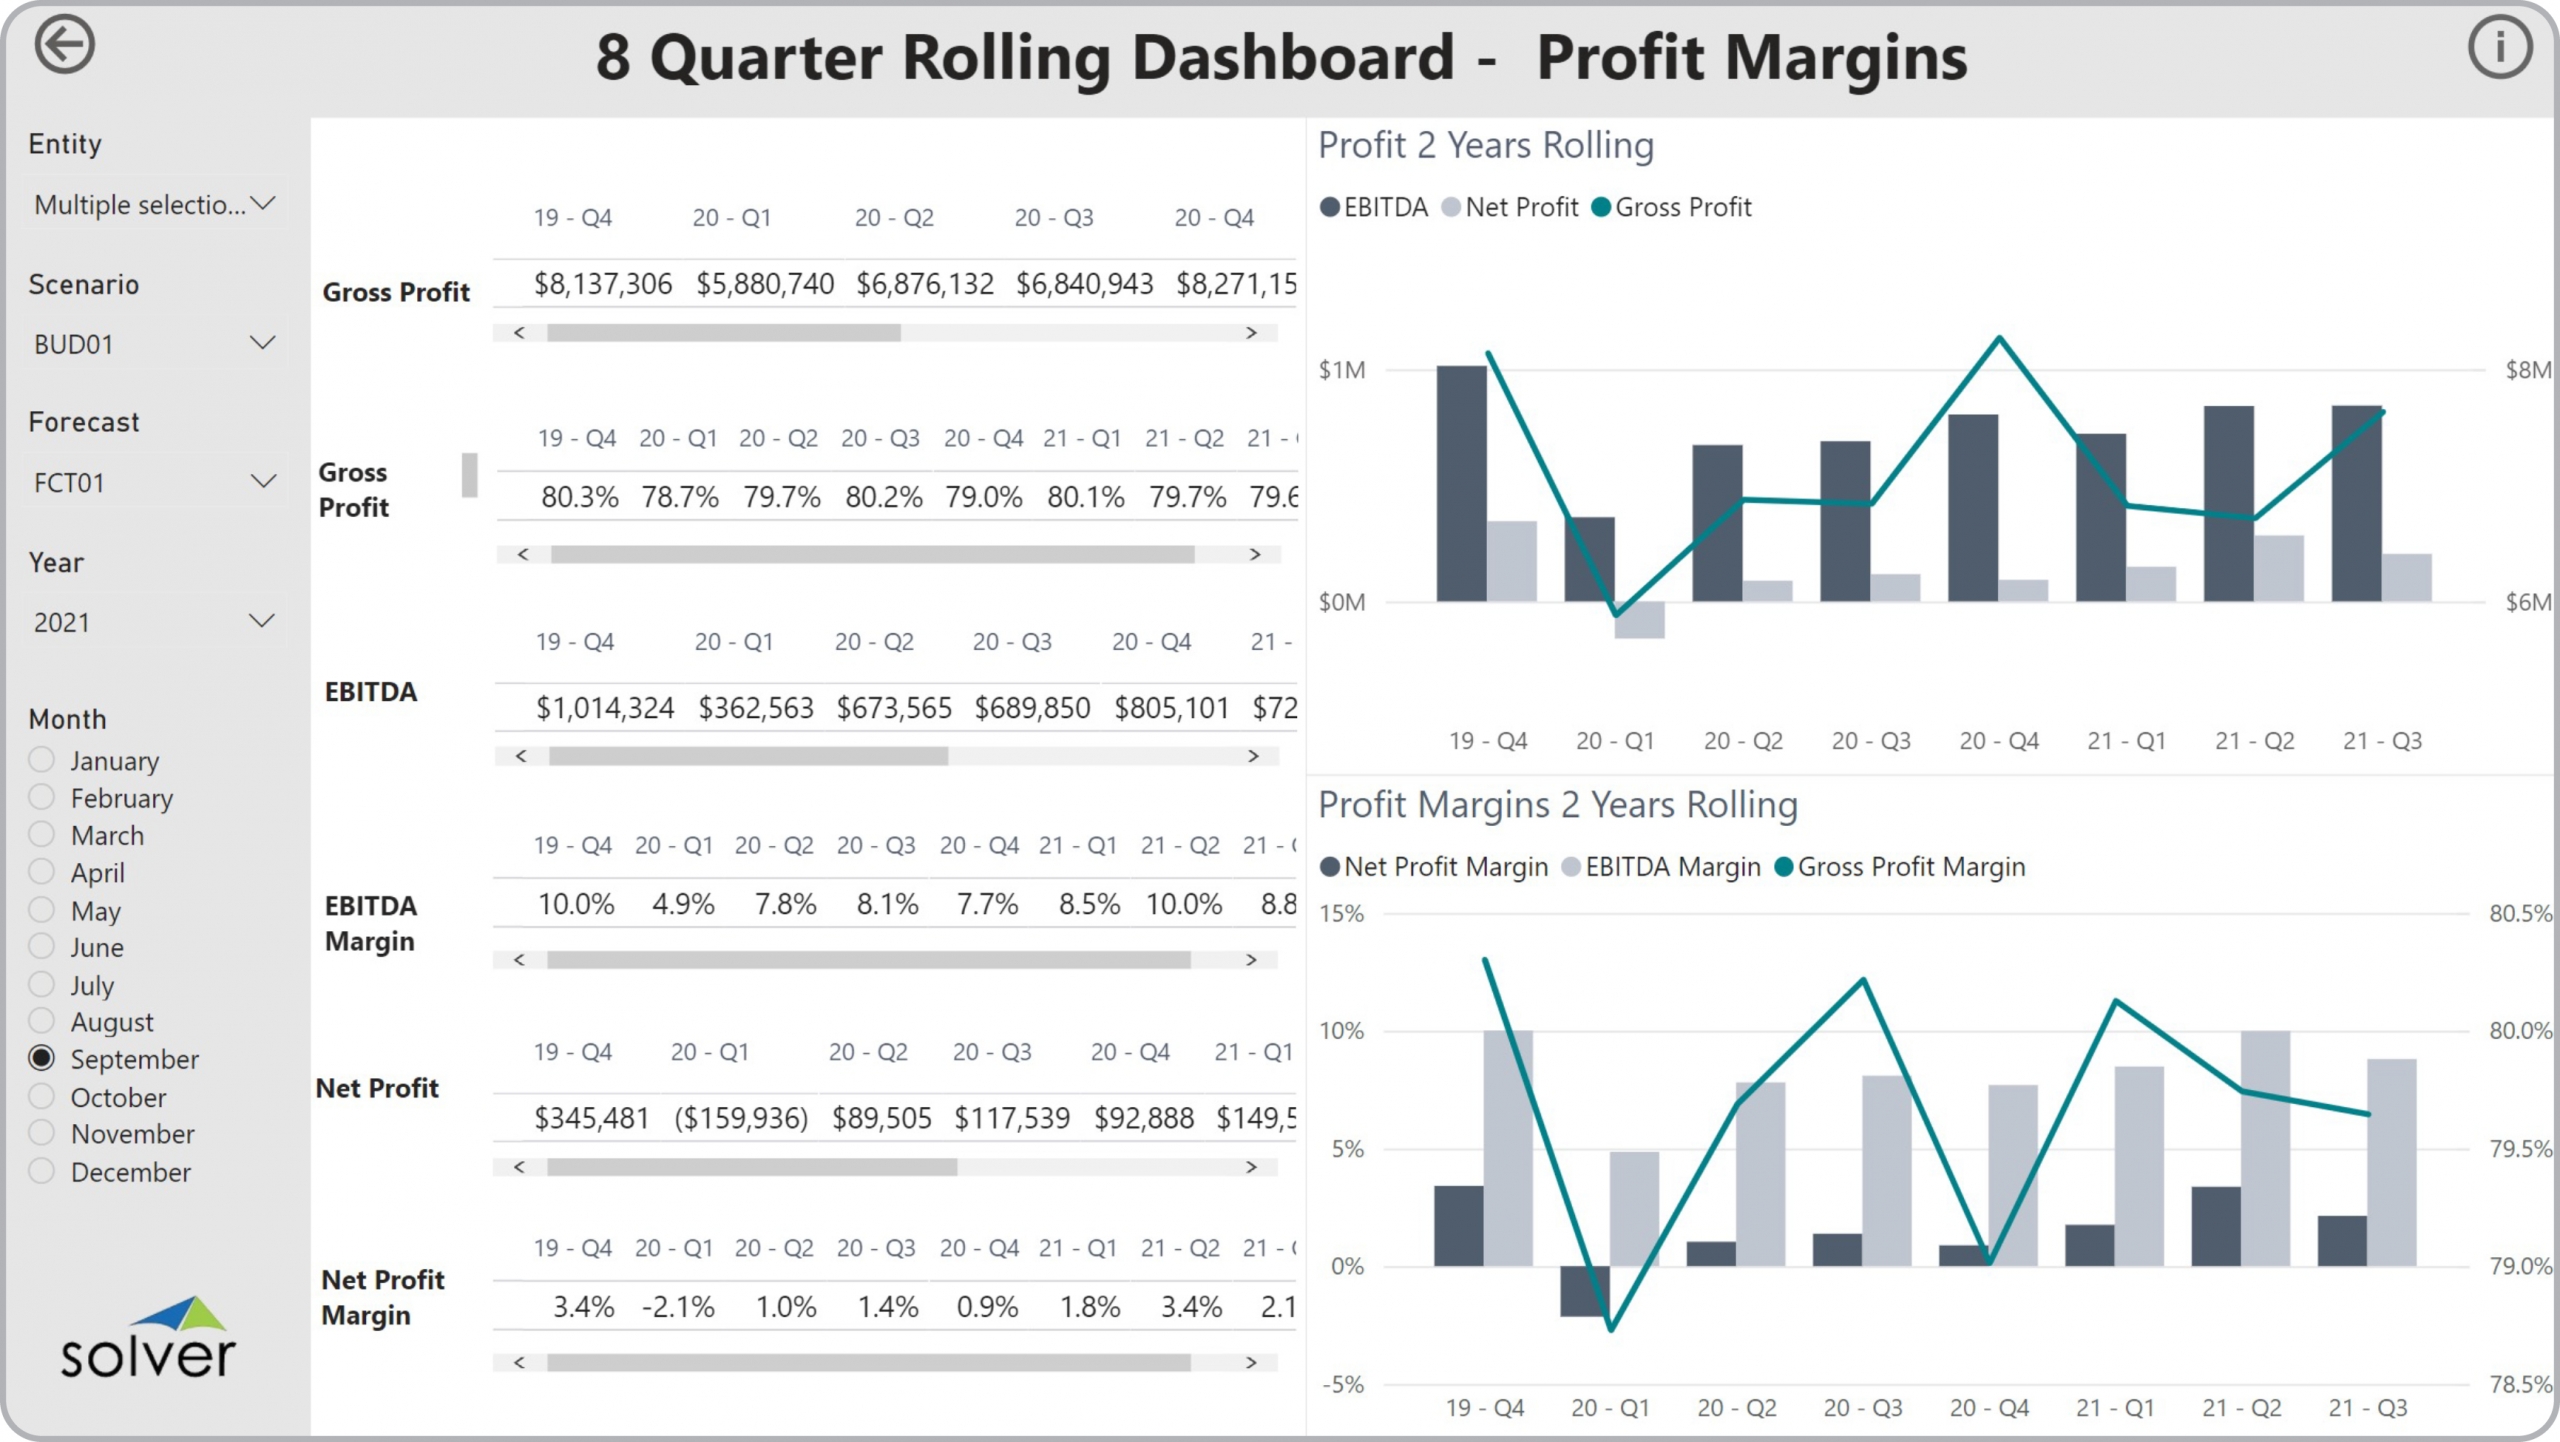
Dashboard
GL Dashboard – 8 Quarter Profitability Trend
It gives CFOs, FP&A managers, and business unit leaders fast, reliable access to the financial and operational insights they need — without custom development.
$
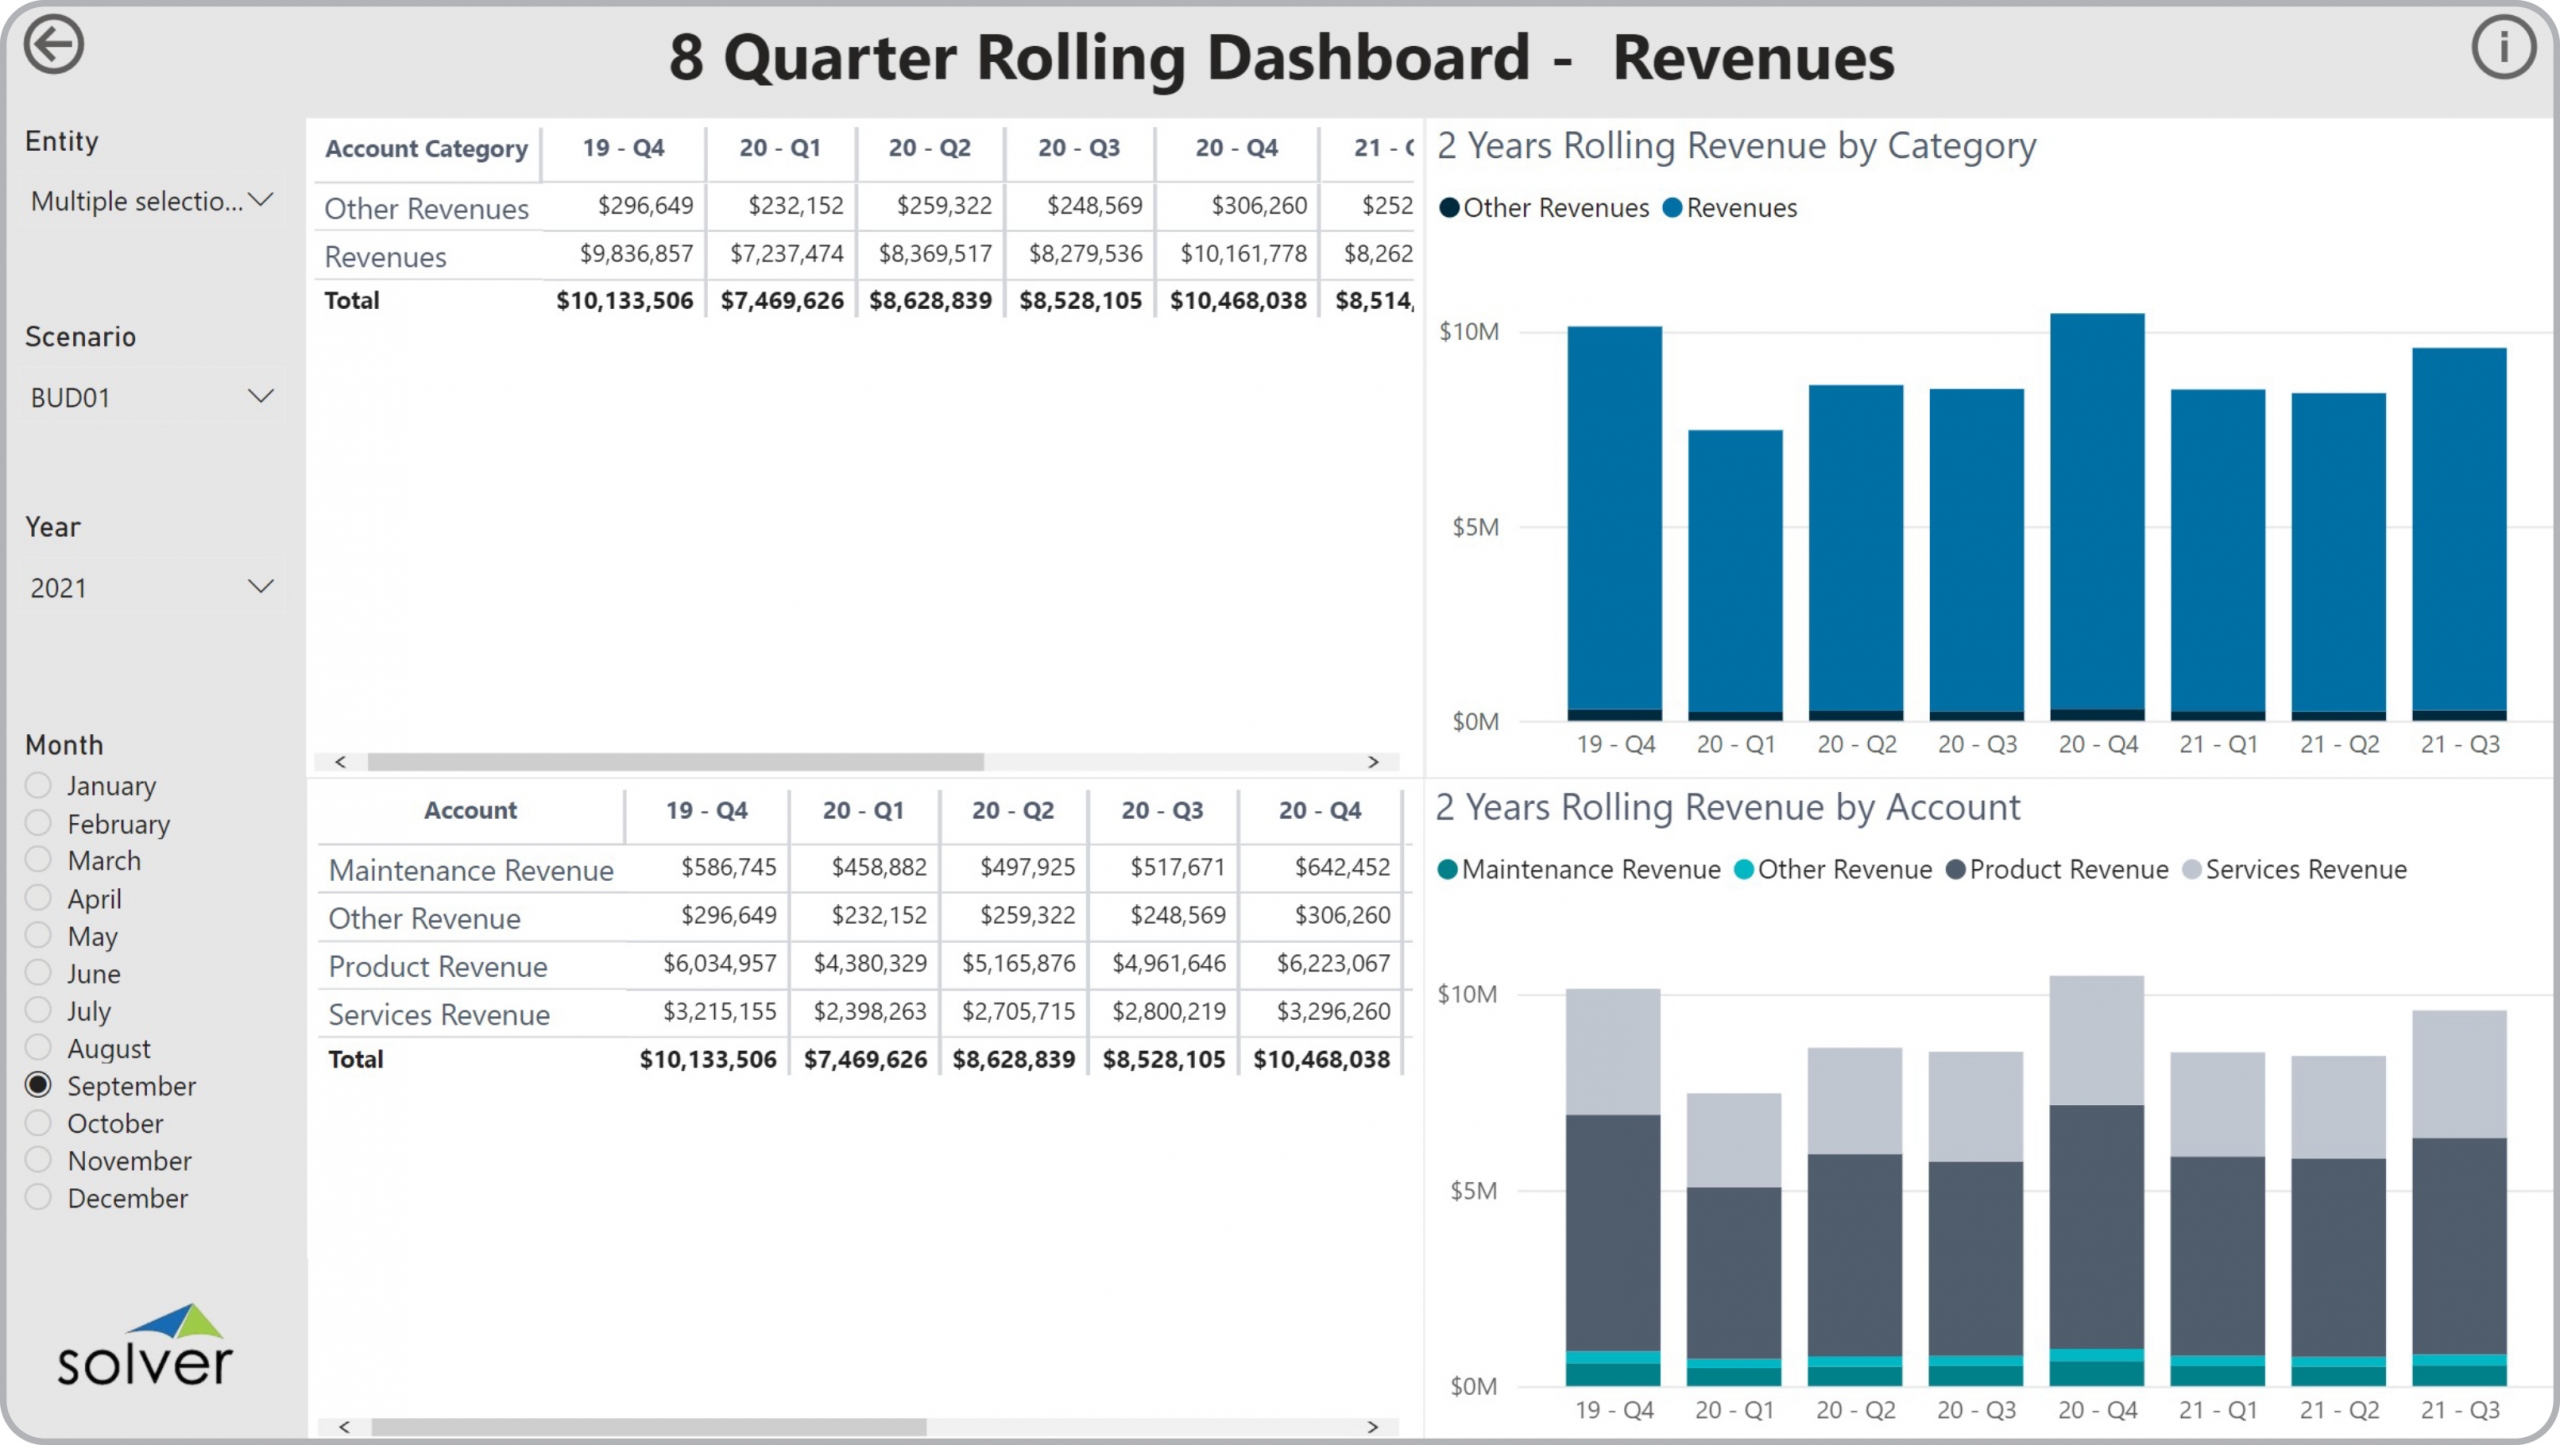
Dashboard
GL Dashboard – 8 Quarter Revenue Trend
It gives CFOs, FP&A managers, and business unit leaders fast, reliable access to the financial and operational insights they need — without custom development.
$
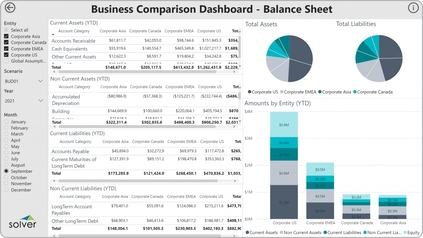
Dashboard
GL Dashboard – Business Comparison – Balance Sheet
It gives CFOs, FP&A managers, and business unit leaders fast, reliable access to the financial and operational insights they need — without custom development.
$
Dashboard
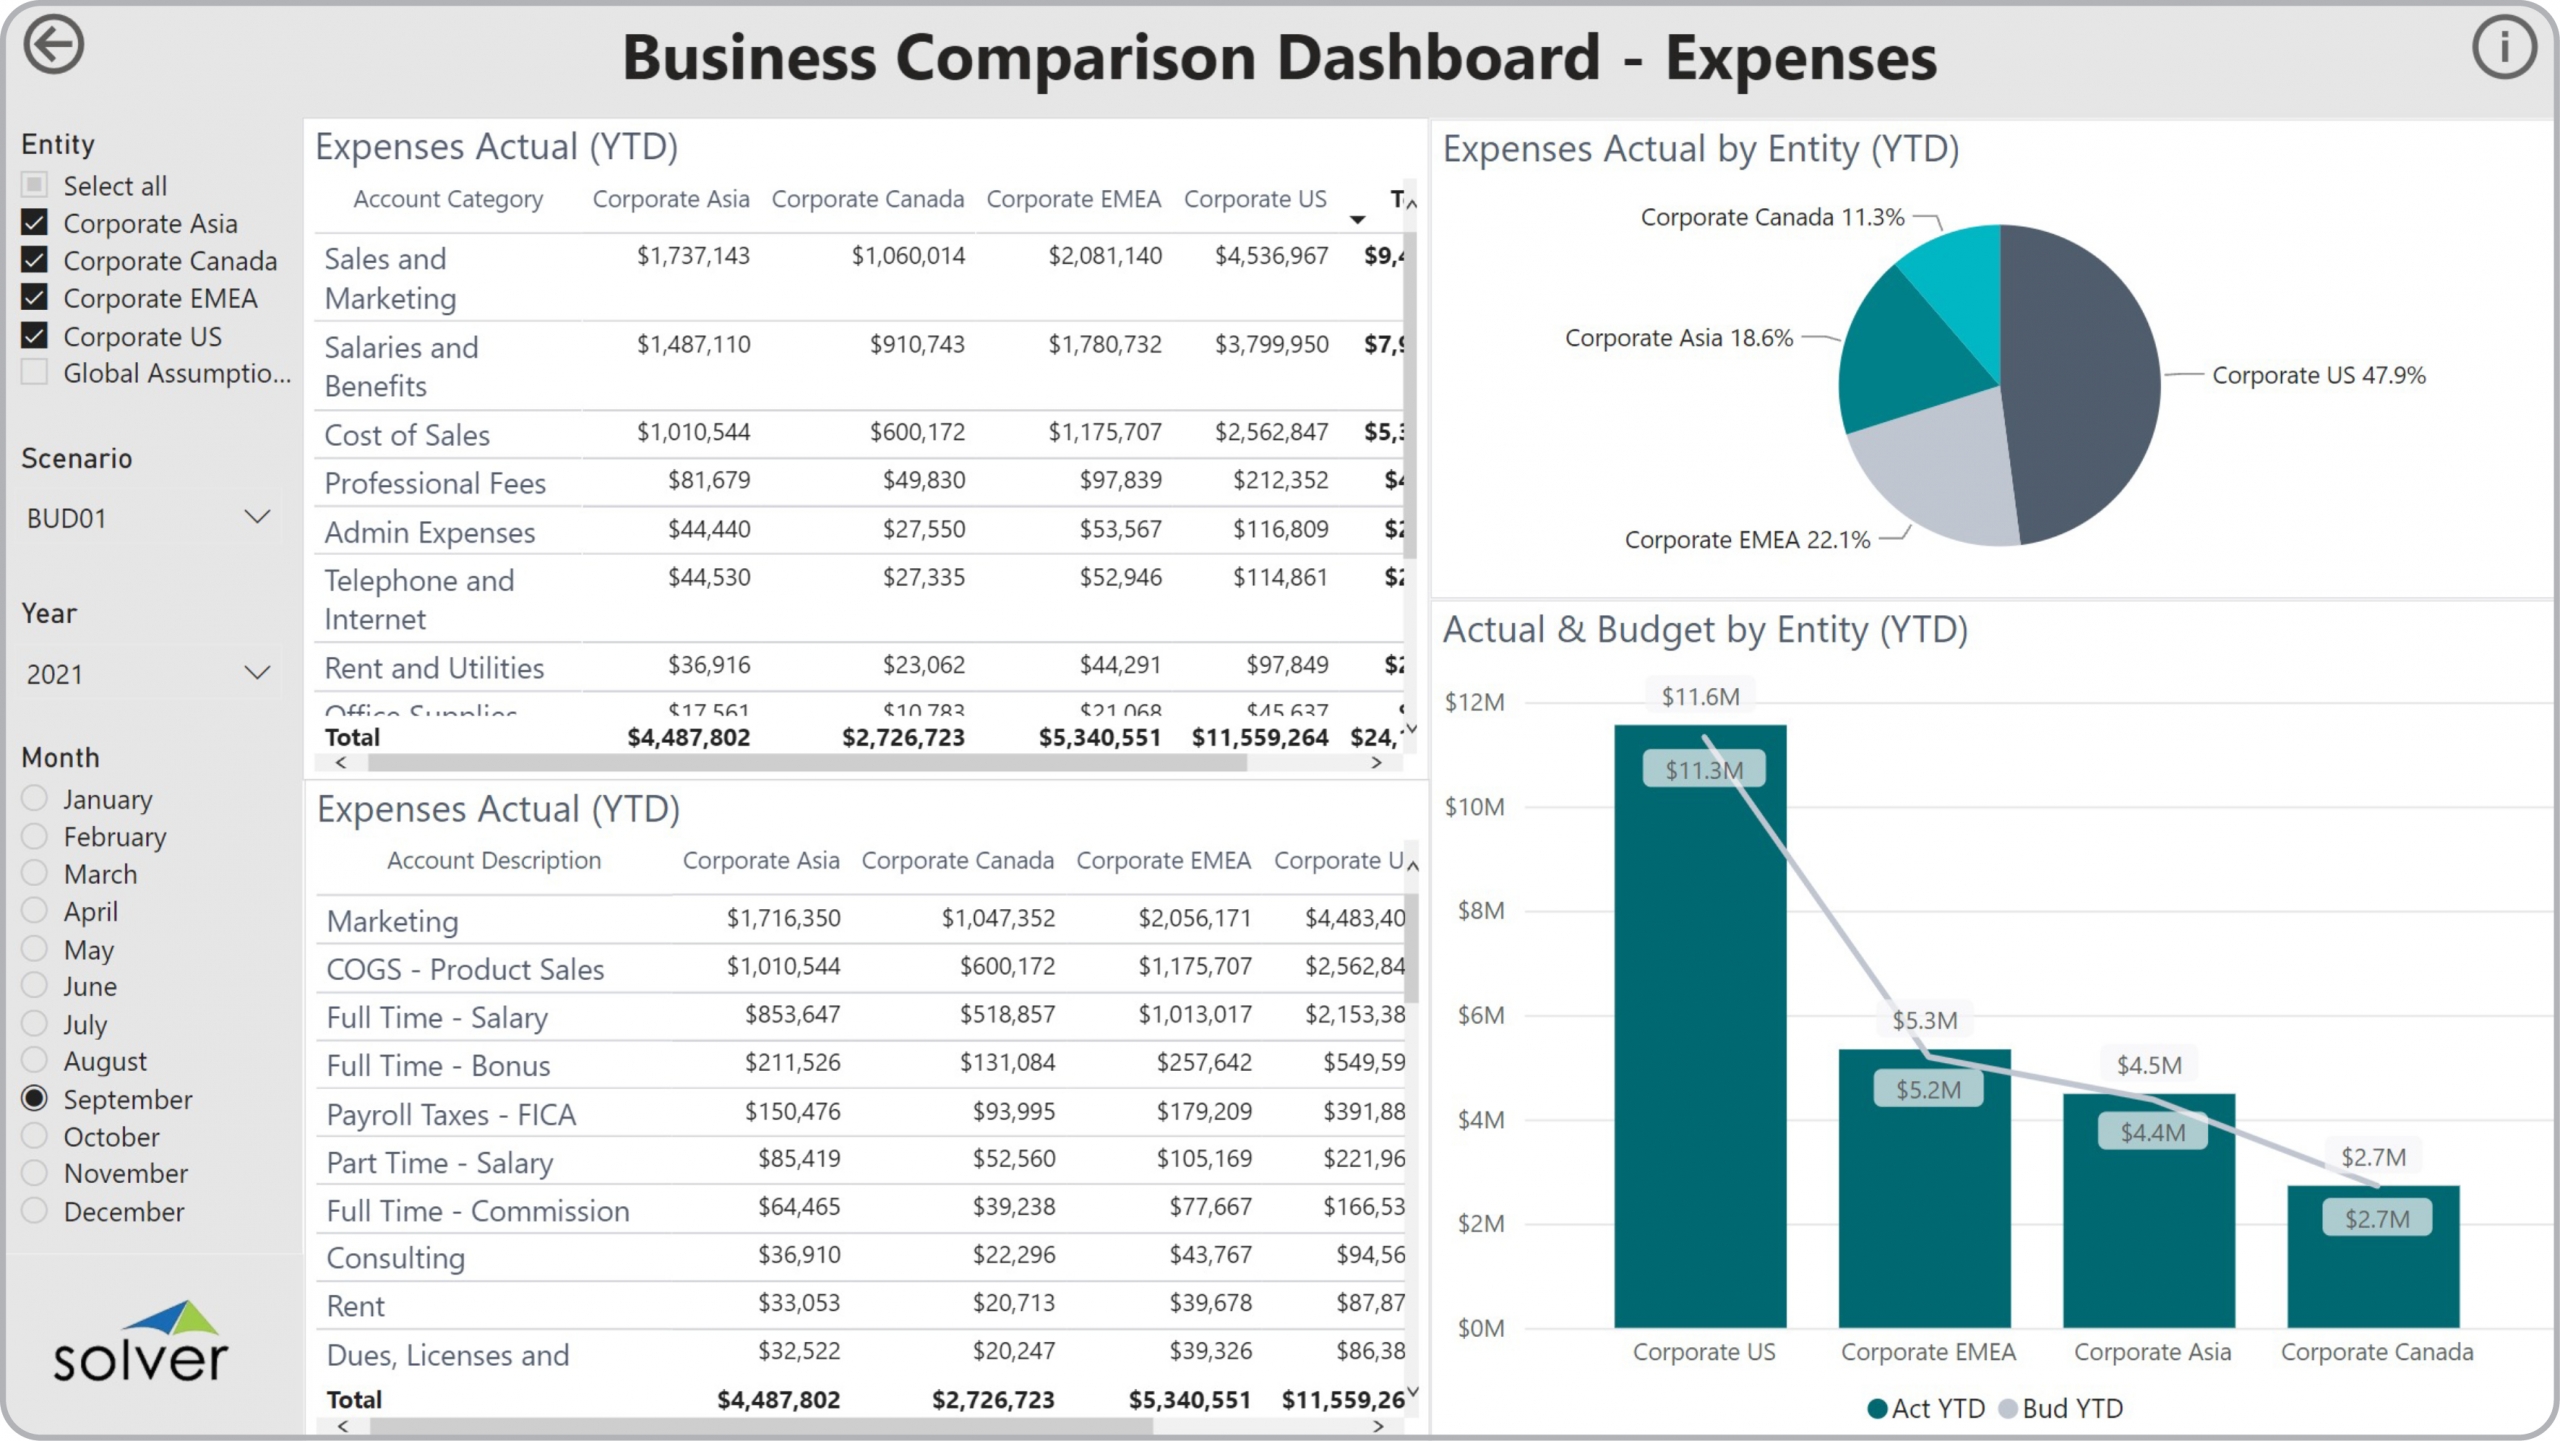
GL Dashboard – Business Comparison – Expenses
Expense Comparison Dashboards to Streamline the Monthly Reporting and Consolidations Process
$
Dashboard
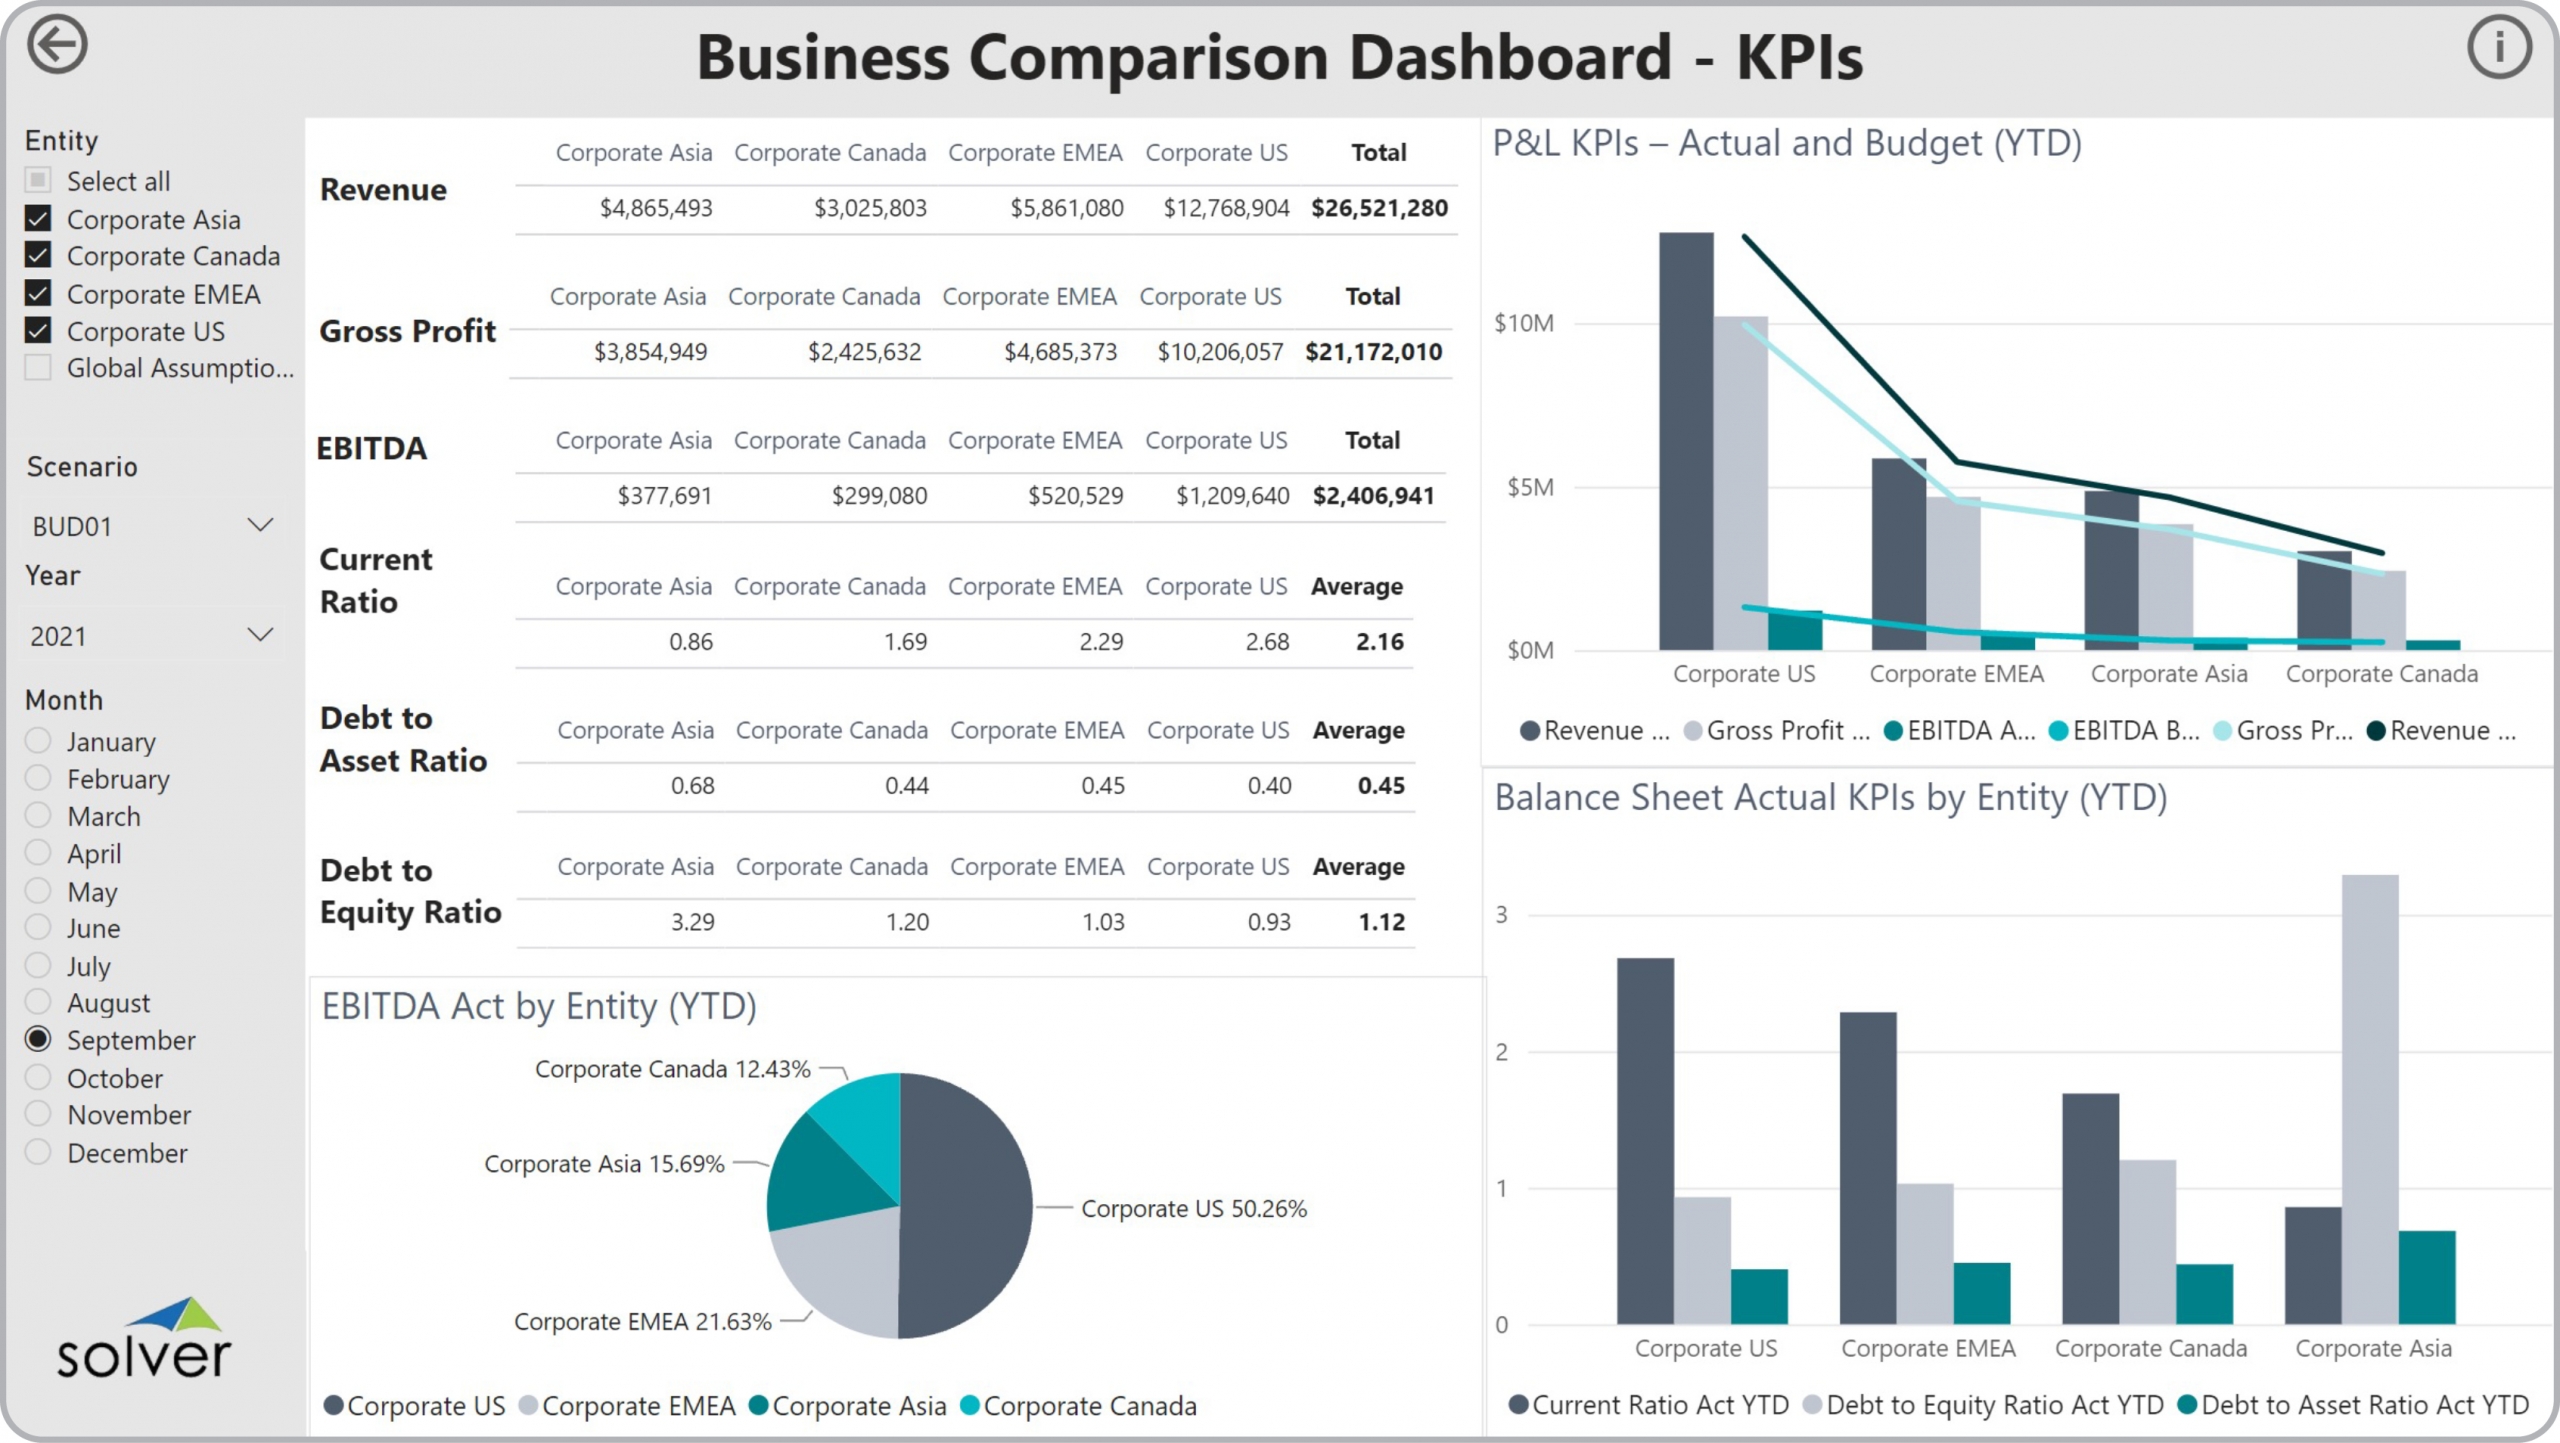
GL Dashboard – Business Comparison – KPIs
It gives CFOs, FP&A managers, and business unit leaders fast, reliable access to the financial and operational insights they need — without custom development.
$