
How can
Financial Statement
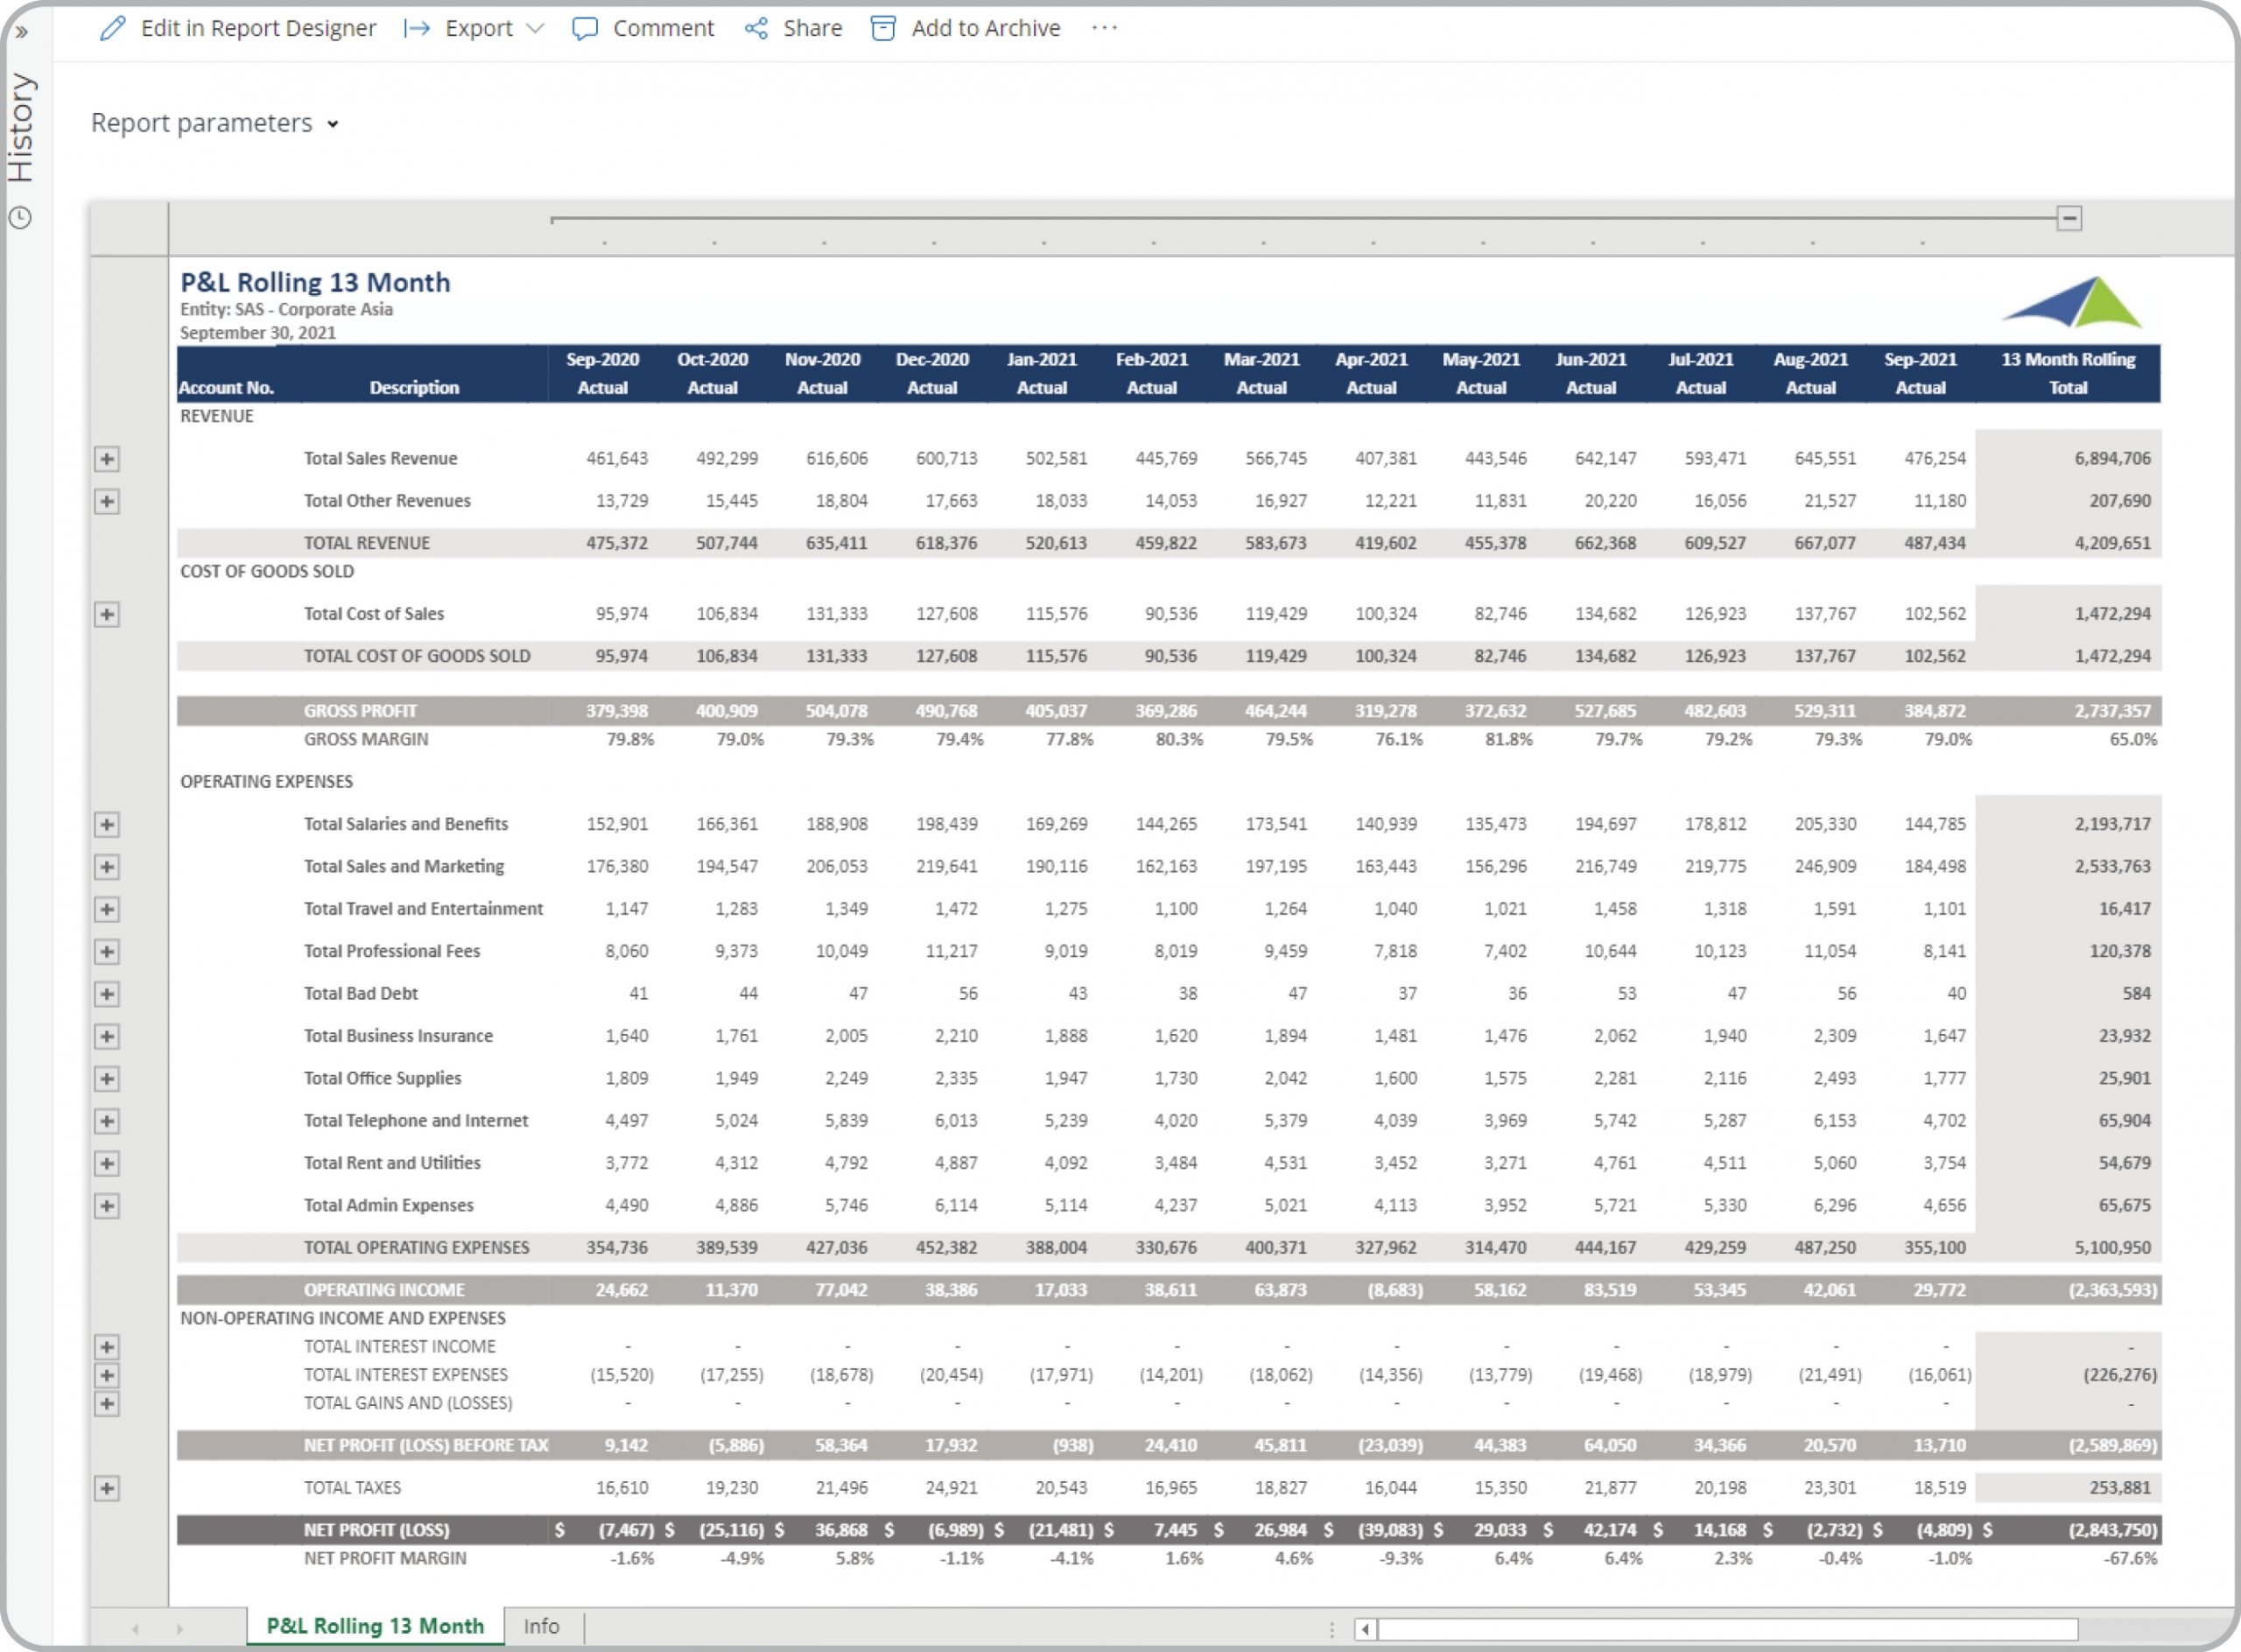
s Drive Faster and Better Decisions? As CFOs increasingly become key advisors in the Monthly Reporting Process, they must rely on modern self-service corporate performance management (CPM) and business intelligence (BI) tools. Using interactive Financial Statements like the Rolling 13 Month P&L Trend Report template shown below enables them and users from the leadership teams to experience near real time trend analysis for revenues, expenses and margins that help drive faster and better decisions.
Who uses
Rolling 13 Month P&L Trend Report
s and What are Some Key Analytical Features? In today’s fast-paced business environment, CFOs are under high pressure to supply end users like CFOs and executive leaders with timely and concise Financial Statements. Companies use key features like the ones below to support their users with effective analysis that helps drive better decisions based on continuous trend data:
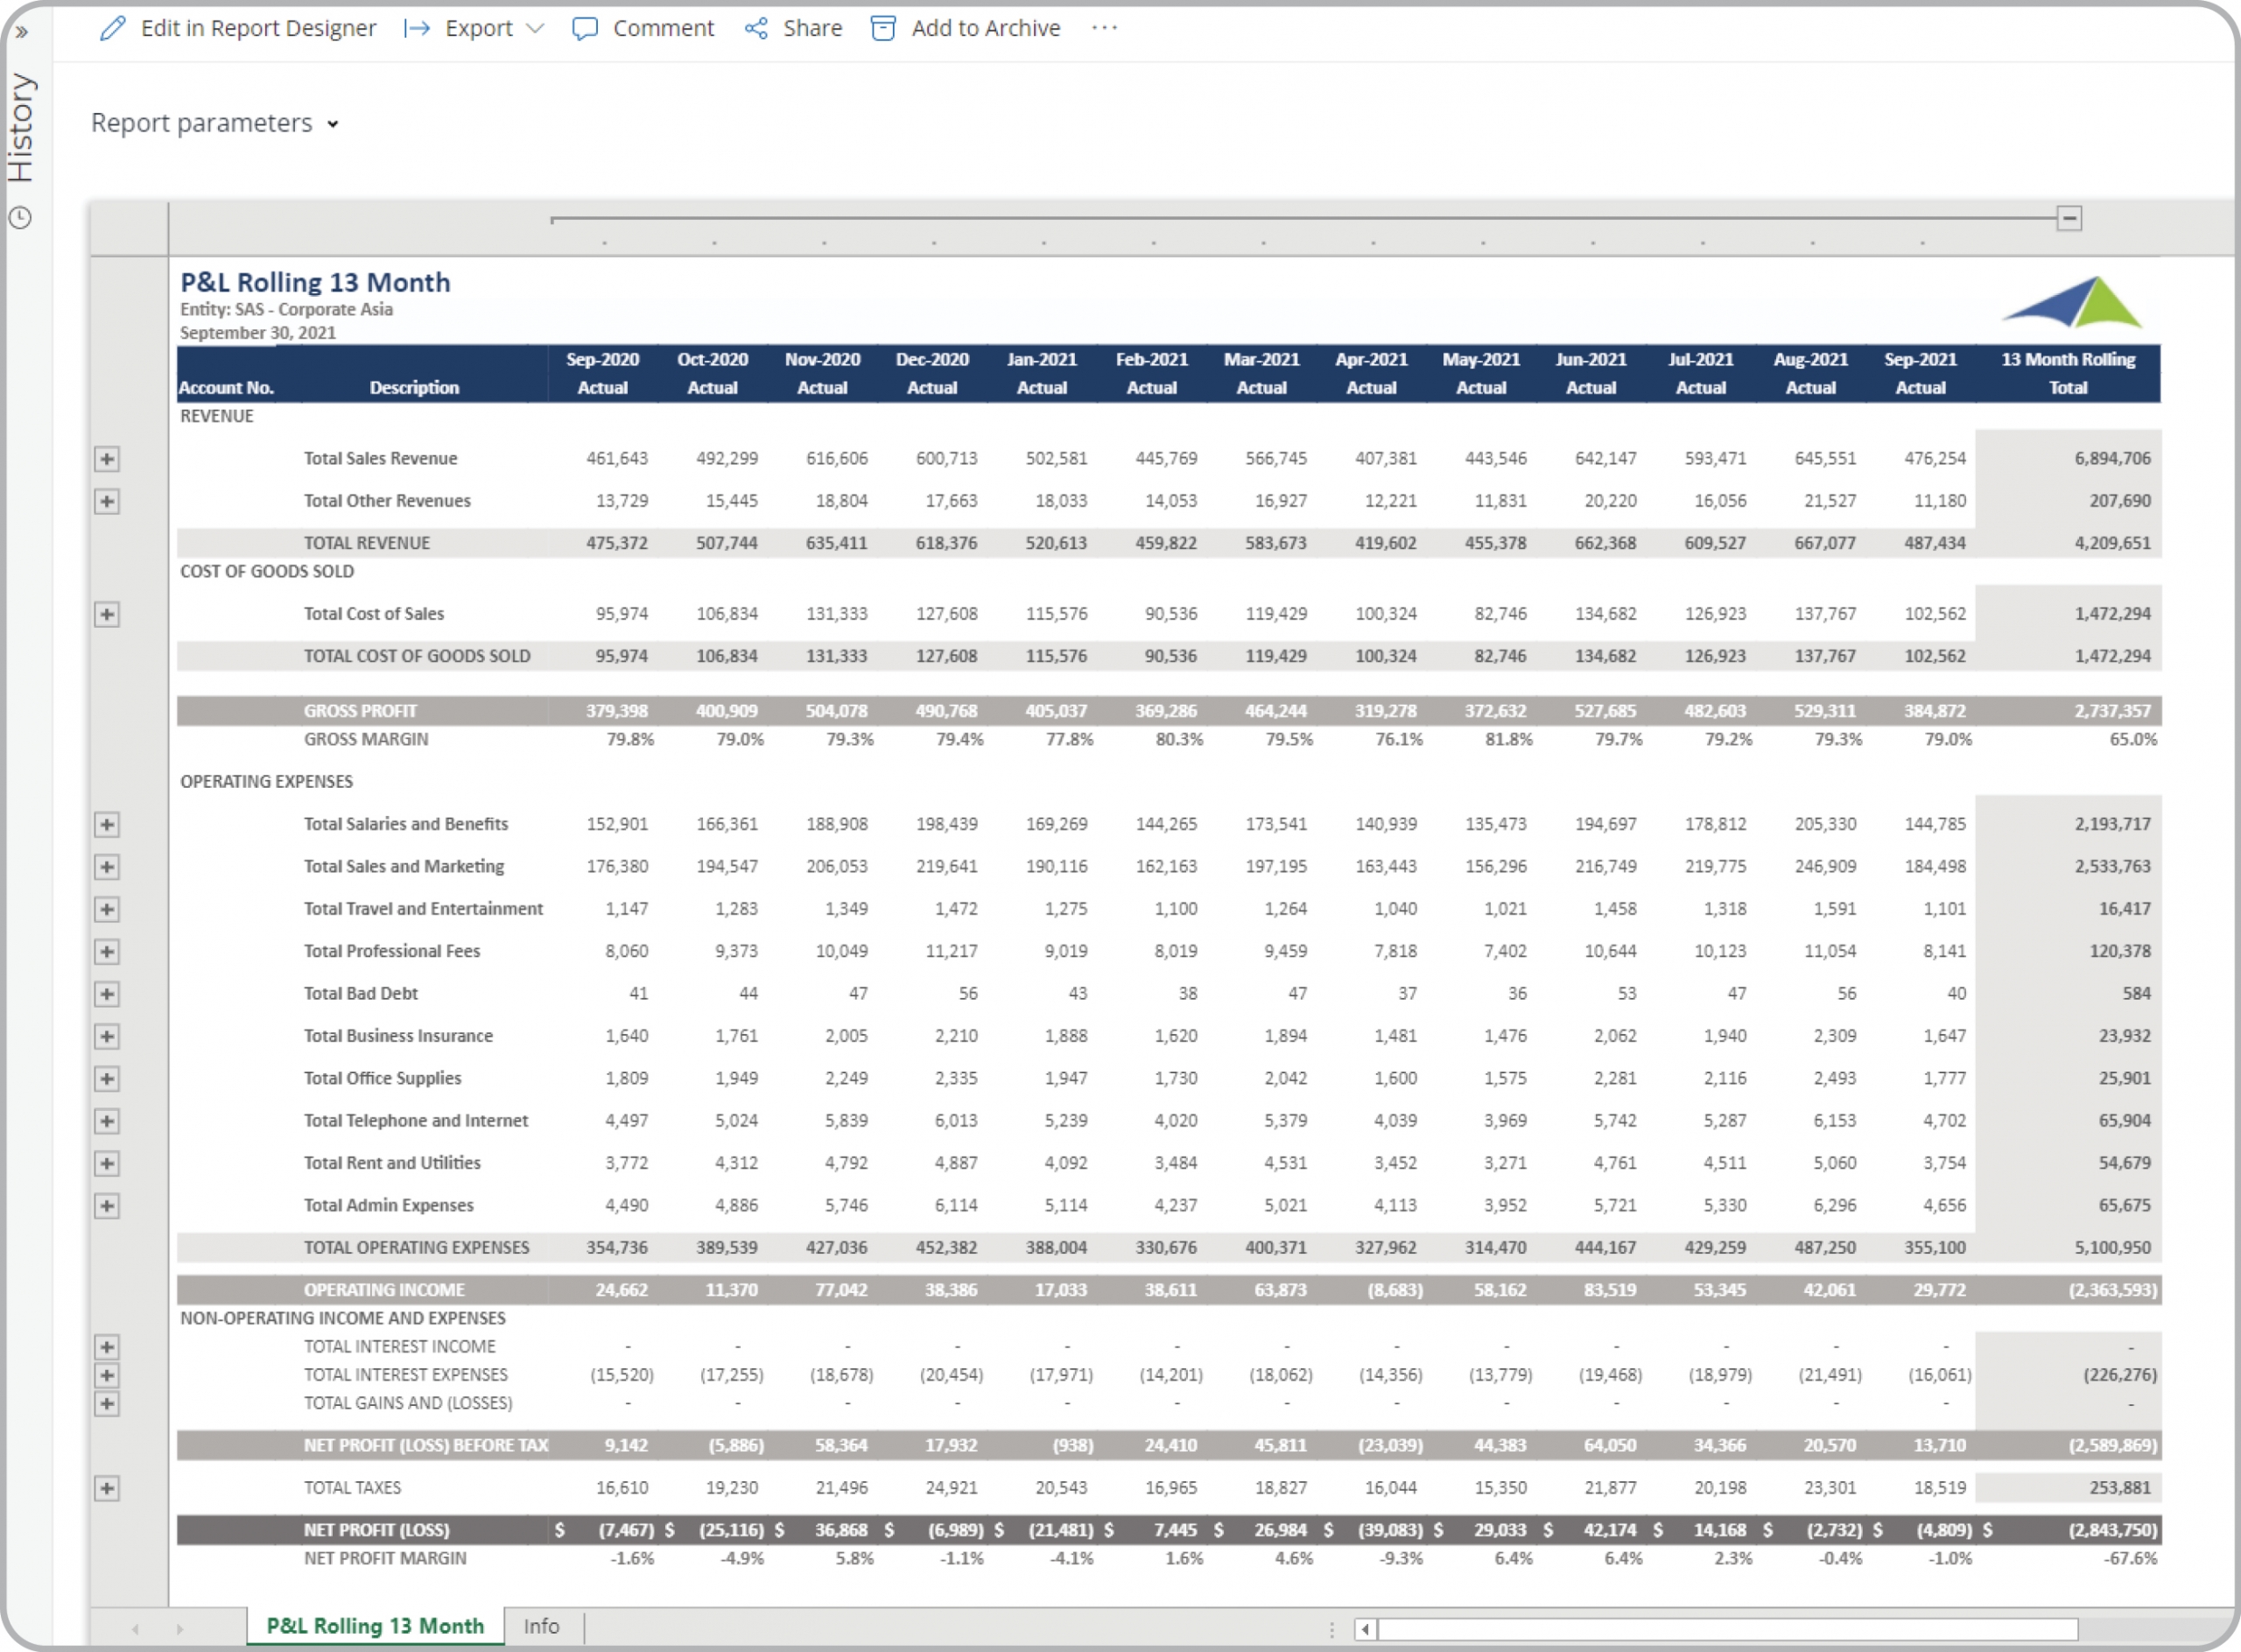 Example of a Rolling 13 Month P&L Trend Report to Streamline the Monthly Reporting Process[/caption] The Rolling 13 Month P&L Trend Report is a ready-to-use Financial Statement from the
Solver Marketplace.
A Brief Description of the
Rolling 13 Month P&L Trend Report
Template Financial Statements like the one seen in the image above are interactive and parameter driven and typically contain sections with advanced Profit & Loss row layout and 13 historical columns with a total. One of the important features that aid the user in the analysis process is the ability to do on-the-fly trend analysis without being locked into a calendar or fiscal year. Rolling 13 Month P&L Trend Reports are often used in conjunction with profit & loss variance reports, balance sheets trends reports, forecast input models and trend dashboards.
Data Integration to Transaction Systems Most organizations these days want automated and streamlined
planning,
reporting and
analysis. However, many of the benefits described earlier rely on best of breed Corporate Performance Management (CPM) tools and/or Business Intelligence (BI) capabilities as well as data marts or data warehouses that use pre-built integrations to the organization’s ERP system. Oftentimes, they also need integrations to other key data sources like CRM, subscription systems, payroll tools, etc. Modern, cloud-based ERPs like Microsoft Dynamics 365 Finance (D365 Finance), Microsoft Dynamics 365 Business Central (D365 BC), Sage Intacct, Acumatica, Netsuite and SAP have robust APIs which allow for dynamic integrations to CPM and BI tools that are fully automated and flexible to run on a schedule or on-demand.
Additional Resources to Aid with Research of Templates, CPM and BI Tools
Example of a Rolling 13 Month P&L Trend Report to Streamline the Monthly Reporting Process[/caption] The Rolling 13 Month P&L Trend Report is a ready-to-use Financial Statement from the
Solver Marketplace.
A Brief Description of the
Rolling 13 Month P&L Trend Report
Template Financial Statements like the one seen in the image above are interactive and parameter driven and typically contain sections with advanced Profit & Loss row layout and 13 historical columns with a total. One of the important features that aid the user in the analysis process is the ability to do on-the-fly trend analysis without being locked into a calendar or fiscal year. Rolling 13 Month P&L Trend Reports are often used in conjunction with profit & loss variance reports, balance sheets trends reports, forecast input models and trend dashboards.
Data Integration to Transaction Systems Most organizations these days want automated and streamlined
planning,
reporting and
analysis. However, many of the benefits described earlier rely on best of breed Corporate Performance Management (CPM) tools and/or Business Intelligence (BI) capabilities as well as data marts or data warehouses that use pre-built integrations to the organization’s ERP system. Oftentimes, they also need integrations to other key data sources like CRM, subscription systems, payroll tools, etc. Modern, cloud-based ERPs like Microsoft Dynamics 365 Finance (D365 Finance), Microsoft Dynamics 365 Business Central (D365 BC), Sage Intacct, Acumatica, Netsuite and SAP have robust APIs which allow for dynamic integrations to CPM and BI tools that are fully automated and flexible to run on a schedule or on-demand.
Additional Resources to Aid with Research of Templates, CPM and BI Tools
- Dynamically created columns with 13 months of history based on the current month
- Expandable rows (to drill to GL account and below)
- Period and company filters that dynamically drives the report content
 Example of a Rolling 13 Month P&L Trend Report to Streamline the Monthly Reporting Process[/caption] The Rolling 13 Month P&L Trend Report is a ready-to-use Financial Statement from the
Solver Marketplace.
A Brief Description of the
Rolling 13 Month P&L Trend Report
Template Financial Statements like the one seen in the image above are interactive and parameter driven and typically contain sections with advanced Profit & Loss row layout and 13 historical columns with a total. One of the important features that aid the user in the analysis process is the ability to do on-the-fly trend analysis without being locked into a calendar or fiscal year. Rolling 13 Month P&L Trend Reports are often used in conjunction with profit & loss variance reports, balance sheets trends reports, forecast input models and trend dashboards.
Data Integration to Transaction Systems Most organizations these days want automated and streamlined
planning,
reporting and
analysis. However, many of the benefits described earlier rely on best of breed Corporate Performance Management (CPM) tools and/or Business Intelligence (BI) capabilities as well as data marts or data warehouses that use pre-built integrations to the organization’s ERP system. Oftentimes, they also need integrations to other key data sources like CRM, subscription systems, payroll tools, etc. Modern, cloud-based ERPs like Microsoft Dynamics 365 Finance (D365 Finance), Microsoft Dynamics 365 Business Central (D365 BC), Sage Intacct, Acumatica, Netsuite and SAP have robust APIs which allow for dynamic integrations to CPM and BI tools that are fully automated and flexible to run on a schedule or on-demand.
Additional Resources to Aid with Research of Templates, CPM and BI Tools
Example of a Rolling 13 Month P&L Trend Report to Streamline the Monthly Reporting Process[/caption] The Rolling 13 Month P&L Trend Report is a ready-to-use Financial Statement from the
Solver Marketplace.
A Brief Description of the
Rolling 13 Month P&L Trend Report
Template Financial Statements like the one seen in the image above are interactive and parameter driven and typically contain sections with advanced Profit & Loss row layout and 13 historical columns with a total. One of the important features that aid the user in the analysis process is the ability to do on-the-fly trend analysis without being locked into a calendar or fiscal year. Rolling 13 Month P&L Trend Reports are often used in conjunction with profit & loss variance reports, balance sheets trends reports, forecast input models and trend dashboards.
Data Integration to Transaction Systems Most organizations these days want automated and streamlined
planning,
reporting and
analysis. However, many of the benefits described earlier rely on best of breed Corporate Performance Management (CPM) tools and/or Business Intelligence (BI) capabilities as well as data marts or data warehouses that use pre-built integrations to the organization’s ERP system. Oftentimes, they also need integrations to other key data sources like CRM, subscription systems, payroll tools, etc. Modern, cloud-based ERPs like Microsoft Dynamics 365 Finance (D365 Finance), Microsoft Dynamics 365 Business Central (D365 BC), Sage Intacct, Acumatica, Netsuite and SAP have robust APIs which allow for dynamic integrations to CPM and BI tools that are fully automated and flexible to run on a schedule or on-demand.
Additional Resources to Aid with Research of Templates, CPM and BI Tools
- Templates from Solver that are pre-built and that work out-of-the-box using the Solver CPM cloud. Click here.
- Template examples: You find more than 500 CPM and BI Template examples here.
- Interactive Dashboard examples: Try Power BI dashboard templates from Solver here.
- Software evaluation and selection:
- Vendor Comparison and ROI (free interactive tool)
- Evaluating planning, budgeting and forecasting functionality
- Evaluating Financial Reporting functionality
- Evaluating Dashboard functionality
- Evaluating Data Warehouse functionality to achieve “one version of the truth”
- Demonstrations and other specific assets: Solver Tour Central
- Using third party analysts and consultants to aid in vendor selection
- Creating efficient processes:
February 10, 2022
TAGS: Solver, Microsoft, Acumatica, net income, financial statement, Netsuite, D365 BC, comparison, profit, GP, QuickStart, rolling, report templates, CFOs, ax, forecast, Budget, Microsoft Dynamics, Dynamics 365, Dynamics 365 Business Central, Sage Intacct, General Ledger, dashboard templates, KPI, budget templates, Oracle, dynamics 365 finance, SAP, templates, Sage, business one, financial templates, P&L, D365, NAV, Intacct, loss, monthly, BI, Variance, Monthly Reporting, GL, CPM, results, SL, dynamics, income, EPM, CFOs and executive leaders, Rolling 13 Month P&L Trend Report