
What is
a
Trended Balance Sheet Report
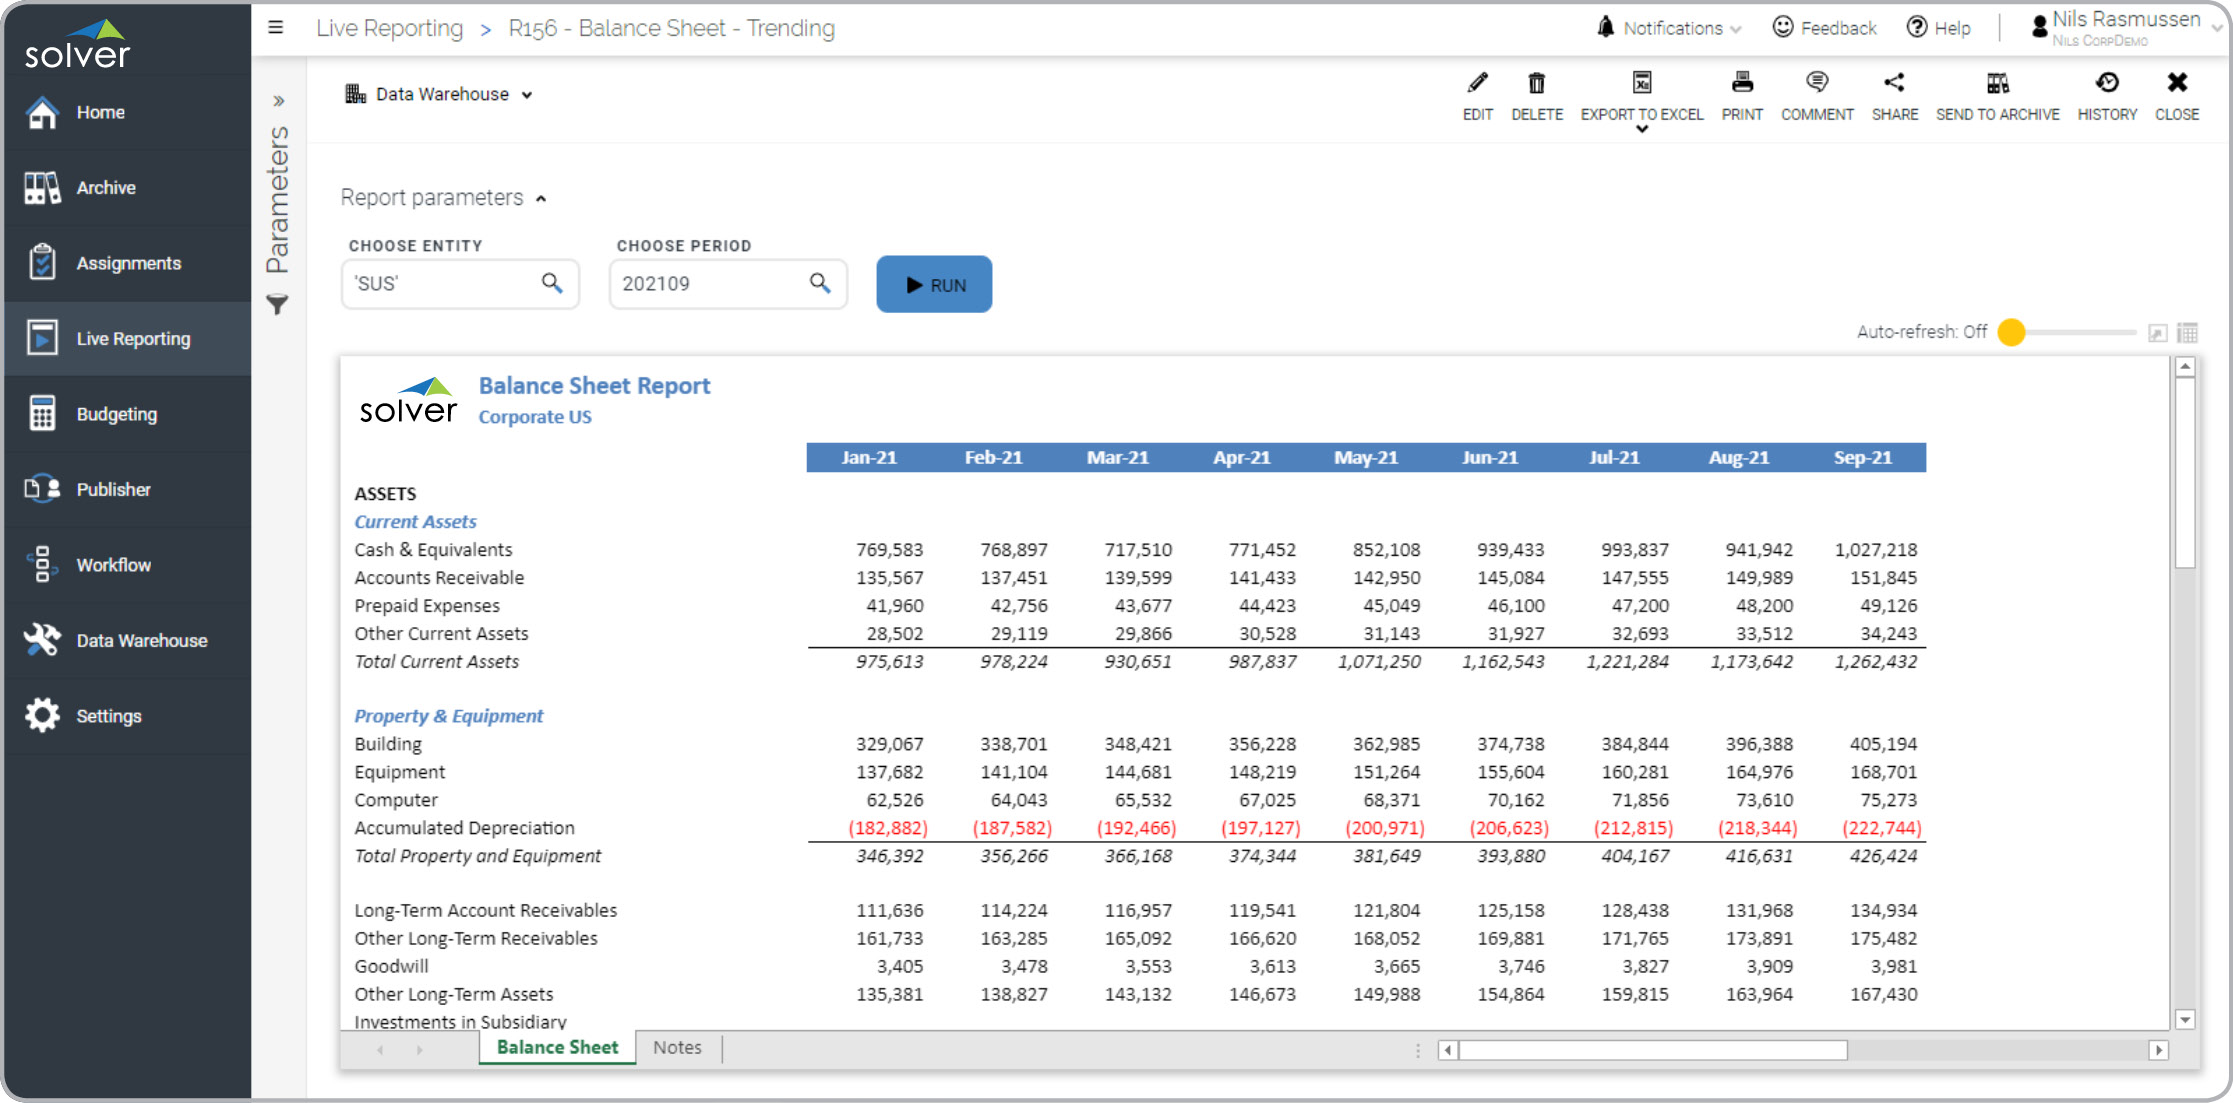
? Trended Balance Sheets are considered key month-end reports in many companies and are often used by the finance team to analyze monthly trends in assets, liabilities and equity. Key functionality in this type of report dynamically lists months in the columns, starting with January and going to the current period. Users can drill down on any figure to analyze the underlying transactions. You will find an example of this type of report below.
Purpose of
Balance Sheet Trend Reports Companies and organizations use Balance Sheet Trend Reports to quickly determine upward or downward patterns for any particular item on the statement. When used as part of good business practices in a Finance & Accounting Department, a company can improve its ability to quickly detect trends or exceptions, as well as, reduce the chance that issues are caught late in the process on important items like cash, receivables or payables.
Balance Sheet Trend Report
Example Here is an example of Trended Balance Sheet report with months across the columns. [caption id="" align="alignnone" width="2233"]
 Trended Balance Sheet Report Example[/caption] You can find hundreds of additional examples
here
Who Uses This Type of
Report
? The typical users of this type of report are: Board Members, the Executive Team and Controllers.
Other
Report
s Often Used in Conjunction with
Balance Sheet Trend Reports Progressive Finance & Accounting Departments sometimes use several different Balance Sheet Trend Reports, along with trended profit & loss reports, cash flow statements and other management and control tools.
Where Does the Data for Analysis Originate From? The Actual (historical transactions) data typically comes from enterprise resource planning (ERP) systems like: Microsoft Dynamics 365 (D365) Finance, Microsoft Dynamics 365 Business Central (D365 BC), Microsoft Dynamics AX, Microsoft Dynamics NAV, Microsoft Dynamics GP, Microsoft Dynamics SL, Sage Intacct, Sage 100, Sage 300, Sage 500, Sage X3, SAP Business One, SAP ByDesign, Acumatica, Netsuite and others. In analyses where budgets or forecasts are used, the planning data most often originates from in-house Excel spreadsheet models or from professional corporate performance management (CPM/EPM) solutions.
What Tools are Typically used for Reporting, Planning and Dashboards? Examples of business software used with the data and ERPs mentioned above are:
Trended Balance Sheet Report Example[/caption] You can find hundreds of additional examples
here
Who Uses This Type of
Report
? The typical users of this type of report are: Board Members, the Executive Team and Controllers.
Other
Report
s Often Used in Conjunction with
Balance Sheet Trend Reports Progressive Finance & Accounting Departments sometimes use several different Balance Sheet Trend Reports, along with trended profit & loss reports, cash flow statements and other management and control tools.
Where Does the Data for Analysis Originate From? The Actual (historical transactions) data typically comes from enterprise resource planning (ERP) systems like: Microsoft Dynamics 365 (D365) Finance, Microsoft Dynamics 365 Business Central (D365 BC), Microsoft Dynamics AX, Microsoft Dynamics NAV, Microsoft Dynamics GP, Microsoft Dynamics SL, Sage Intacct, Sage 100, Sage 300, Sage 500, Sage X3, SAP Business One, SAP ByDesign, Acumatica, Netsuite and others. In analyses where budgets or forecasts are used, the planning data most often originates from in-house Excel spreadsheet models or from professional corporate performance management (CPM/EPM) solutions.
What Tools are Typically used for Reporting, Planning and Dashboards? Examples of business software used with the data and ERPs mentioned above are:
- Native ERP report writers and query tools
- Spreadsheets (for example Microsoft Excel)
- Corporate Performance Management (CPM) tools (for example Solver)
- Dashboards (for example Microsoft Power BI and Tableau)
- View 100’s of reporting, consolidations, planning, budgeting, forecasting and dashboard examples here
- Discover how the Solver CPM solution delivers financial and operational reporting
- Discover how the Solver CPM solution delivers planning, budgeting and forecasting
- Watch demo videos of reporting, planning and dashboards
July 30, 2020
TAGS: Reporting, Solver, report writer, Microsoft, consolidation, template, practice, Acumatica, Netsuite, Finance, GP, Business Central, excel, ax, budgeting, Cloud, Software, Financial, Tableau, SAP, example, best, Sage, BC, D365, NAV, Intacct, Balance Sheet, CPM, report, SL, Management, dynamics, Power BI, comparative