
What is a
Ticket Sales Dashboard
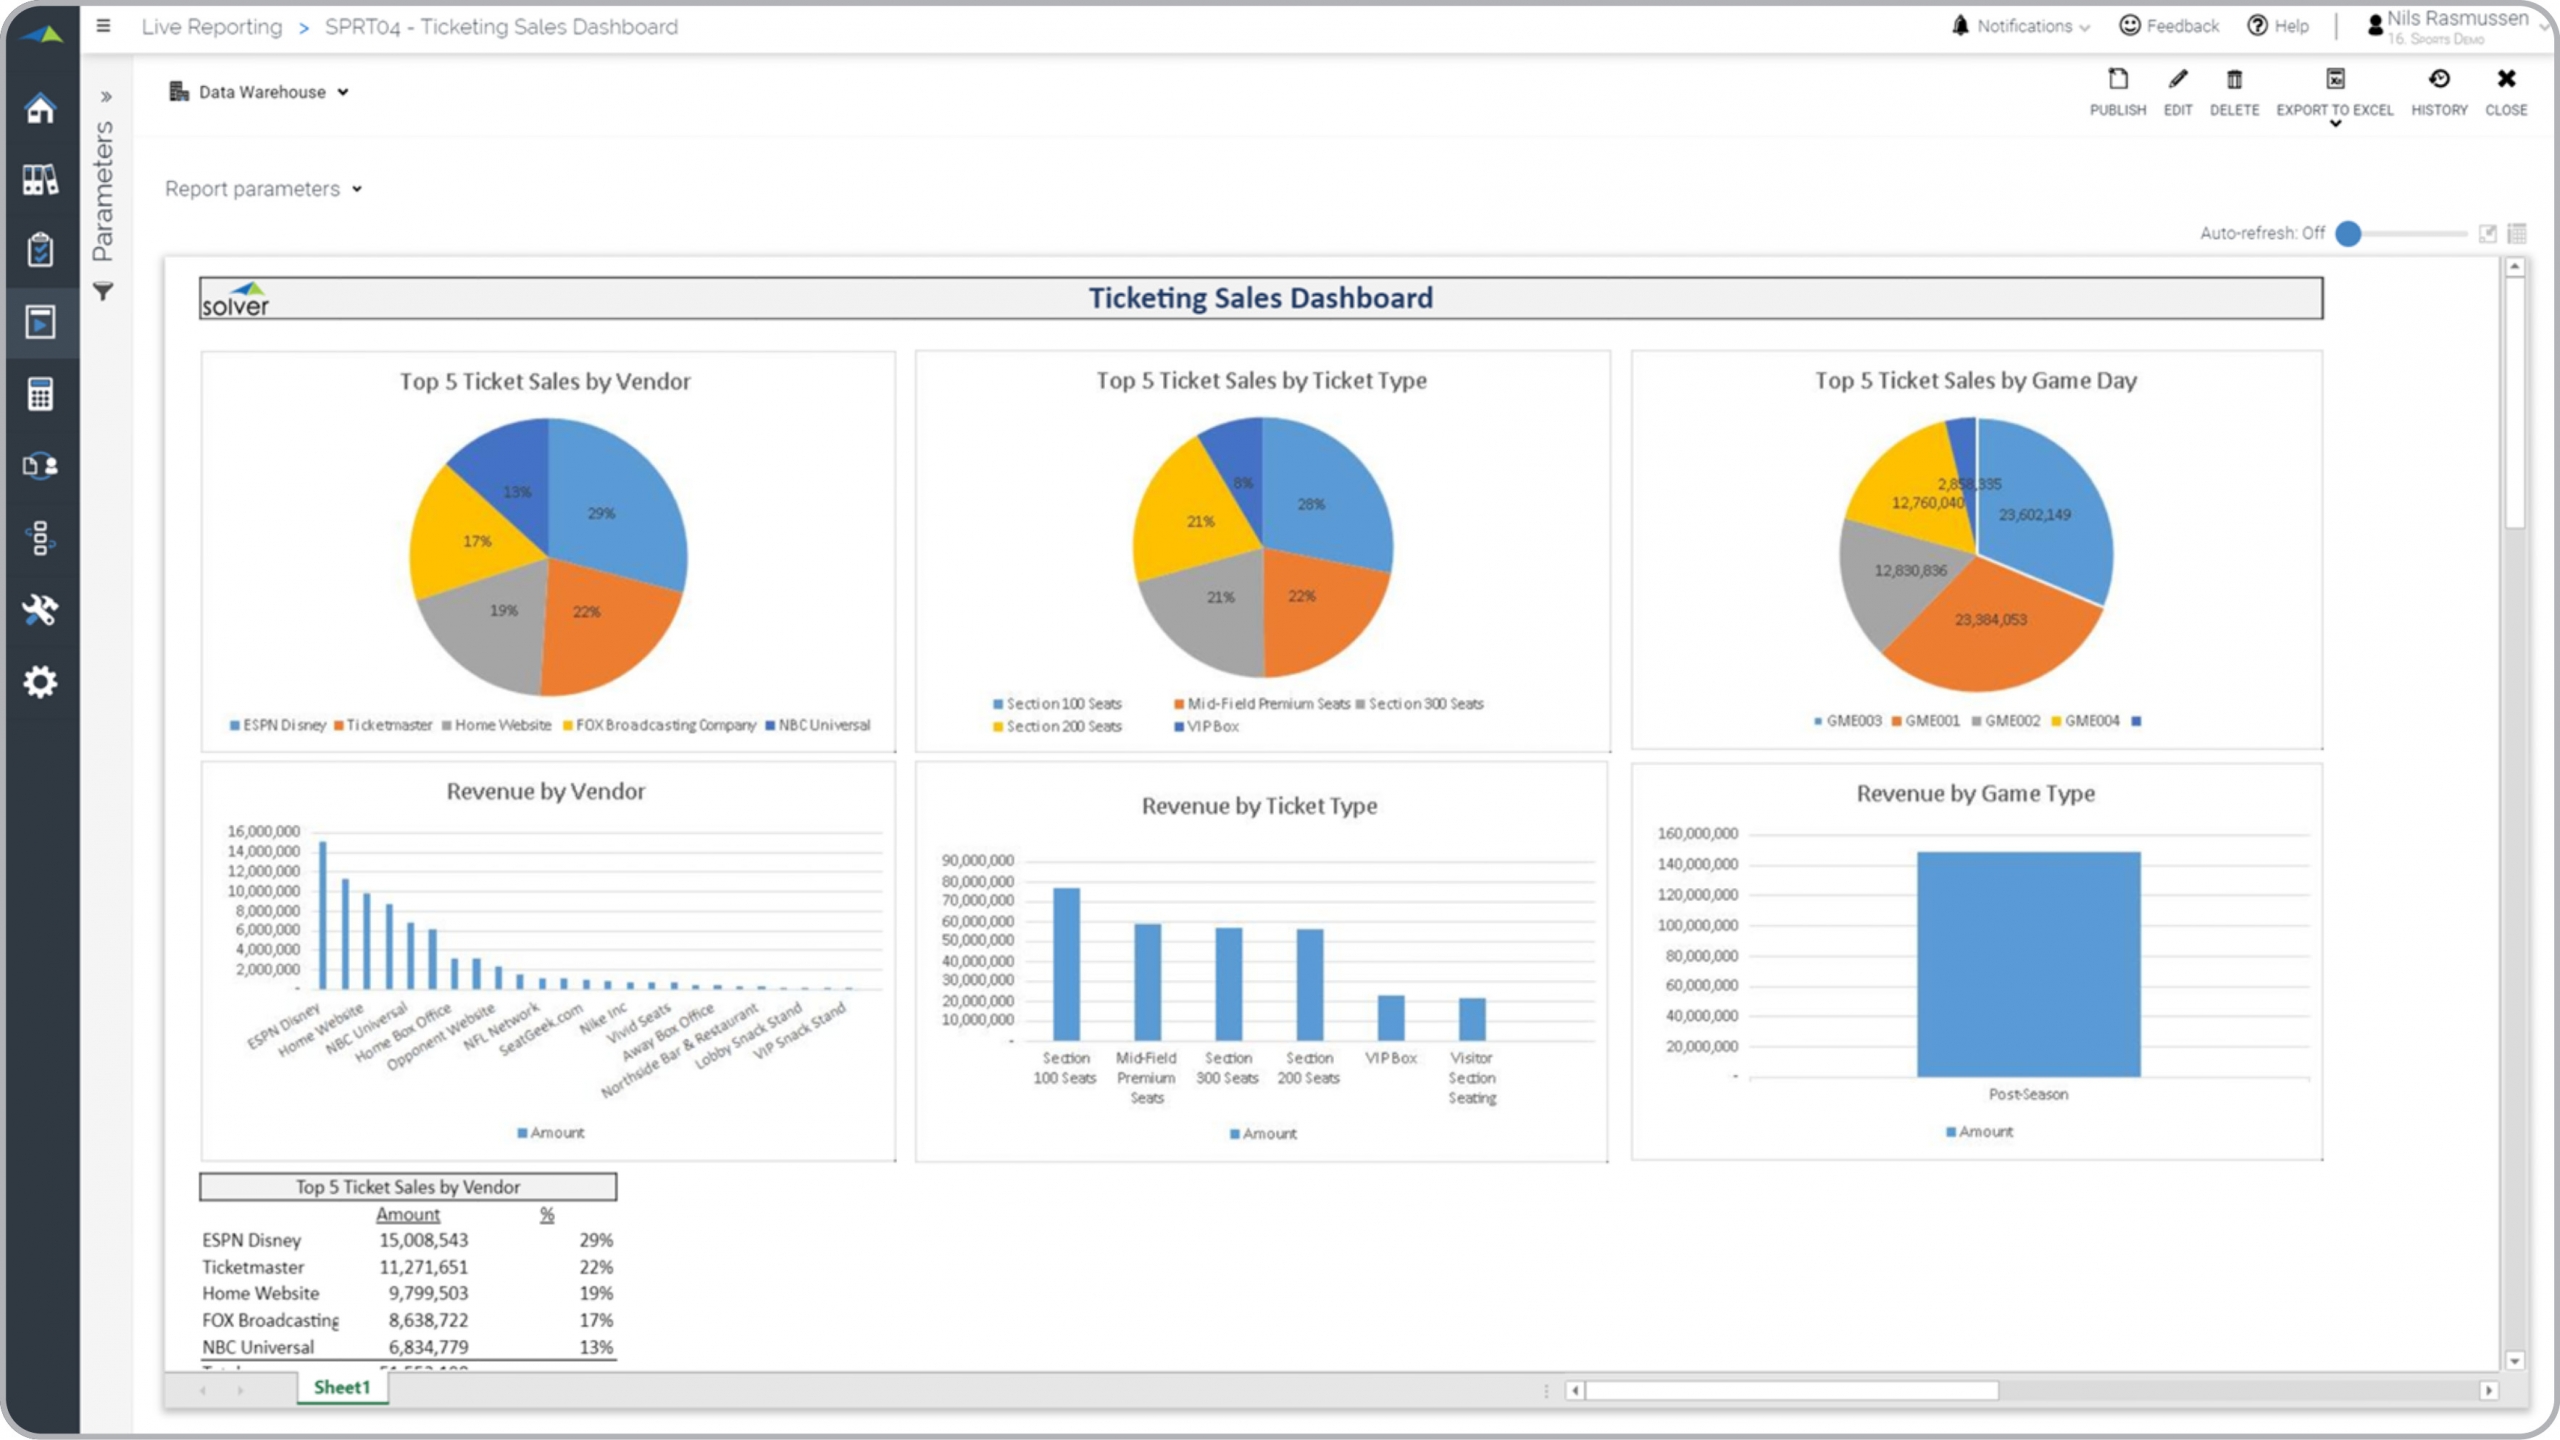
? Ticket Sales Dashboards are considered revenue analysis tools and are used by sales executives and ticket managers to have clear insight into all key aspects of ticket sales revenues. Some of the main functionality in this type of report is that it uses six charts to present key metrics and below the charts it displays tables with related figures. The graphical analysis include: 1) Top 5 vendors based on ticket sales, 2) Top 5 ticket types based on sales, 3) Top 5 games based on ticket sales, 4) Ticket revenue ranked by vendor, 5) Revenue by ticket type, and 6) Revenue by game type. You find an example of this type of report below.
Purpose of
Ticket Sales Dashboards Sports organizations and venues use Ticket Sales Dashboards to enable managers to optimize their decisions that related to ticket strategies. When used as part of good business practices in FP&A and Ticket departments, an organization can improve its ticket sales strategies and it can reduce the chances that revenues become sub-optimized due to lack of informed management decisions.
Example of a
Ticket Sales Dashboard Here is an example of a Ticket Sales Dashboard with analysis of revenues by vendor, ticket type and game. [caption id="" align="alignnone" width="2560"]
 Example of a Ticket Sales Dashboard for Sports Organizations[/caption] You can find hundreds of additional examples
here
Who Uses This Type of
Report
? The typical users of this type of report are: Executives, ticket managers, sales managers, venue managers.
Other Reports Often Used in Conjunction with
Ticket Sales Dashboards Progressive FP&A and Ticket departments sometimes use several different Ticket Sales Dashboards, along with detailed ticket reports, profit & loss reports, sales dashboards, KPI reports, annual budgets and forecasts and other management and control tools.
Where Does the Data for Analysis Originate From? The Actual (historical transactions) data typically comes from enterprise resource planning (ERP) systems like: Microsoft Dynamics 365 (D365) Finance, Microsoft Dynamics 365 Business Central (D365 BC), Microsoft Dynamics AX, Microsoft Dynamics NAV, Microsoft Dynamics GP, Microsoft Dynamics SL, Sage Intacct, Sage 100, Sage 300, Sage 500, Sage X3, SAP Business One, SAP ByDesign, Acumatica, Netsuite and others. In analyses where budgets or forecasts are used, the planning data most often originates from in-house Excel spreadsheet models or from professional corporate performance management (CPM/EPM) solutions.
What Tools are Typically used for Reporting, Planning and Dashboards? Examples of business software used with the data and ERPs mentioned above are:
Example of a Ticket Sales Dashboard for Sports Organizations[/caption] You can find hundreds of additional examples
here
Who Uses This Type of
Report
? The typical users of this type of report are: Executives, ticket managers, sales managers, venue managers.
Other Reports Often Used in Conjunction with
Ticket Sales Dashboards Progressive FP&A and Ticket departments sometimes use several different Ticket Sales Dashboards, along with detailed ticket reports, profit & loss reports, sales dashboards, KPI reports, annual budgets and forecasts and other management and control tools.
Where Does the Data for Analysis Originate From? The Actual (historical transactions) data typically comes from enterprise resource planning (ERP) systems like: Microsoft Dynamics 365 (D365) Finance, Microsoft Dynamics 365 Business Central (D365 BC), Microsoft Dynamics AX, Microsoft Dynamics NAV, Microsoft Dynamics GP, Microsoft Dynamics SL, Sage Intacct, Sage 100, Sage 300, Sage 500, Sage X3, SAP Business One, SAP ByDesign, Acumatica, Netsuite and others. In analyses where budgets or forecasts are used, the planning data most often originates from in-house Excel spreadsheet models or from professional corporate performance management (CPM/EPM) solutions.
What Tools are Typically used for Reporting, Planning and Dashboards? Examples of business software used with the data and ERPs mentioned above are:
- Native ERP report writers and query tools
- Spreadsheets (for example Microsoft Excel)
- Corporate Performance Management (CPM) tools (for example Solver)
- Dashboards (for example Microsoft Power BI and Tableau)
- View 100’s of reporting, consolidations, planning, budgeting, forecasting and dashboard examples here
- View a Sports industry white paper and other industry-specific information here
- See how reports are designed in a modern report writer using a cloud-connected Excel add-in writer
- Discover how the Solver CPM solution delivers financial and operational reporting
- Discover how the Solver CPM solution delivers planning, budgeting and forecasting
- Watch demo videos of reporting, planning and dashboards
June 20, 2021
TAGS: Reporting, Solver, NPSL, report writer, Microsoft, NBA, template, practice, Acumatica, basketball, league, MLB, Netsuite, Finance, planning, GP, dashboard, category, Business Central, excel, professional, ax, Sports, forecast, Budget, Dynamics 365, budgeting, professional sports, revenue, Cloud, Software, Tableau, SAP, NRL, example, NHL, NFL, best, Sage, BC, EPL, D365, MLS, NAV, Intacct, soccer, hockey, baseball, CPM, report, SL, Management, dynamics, football, Power BI, game