
What is
a
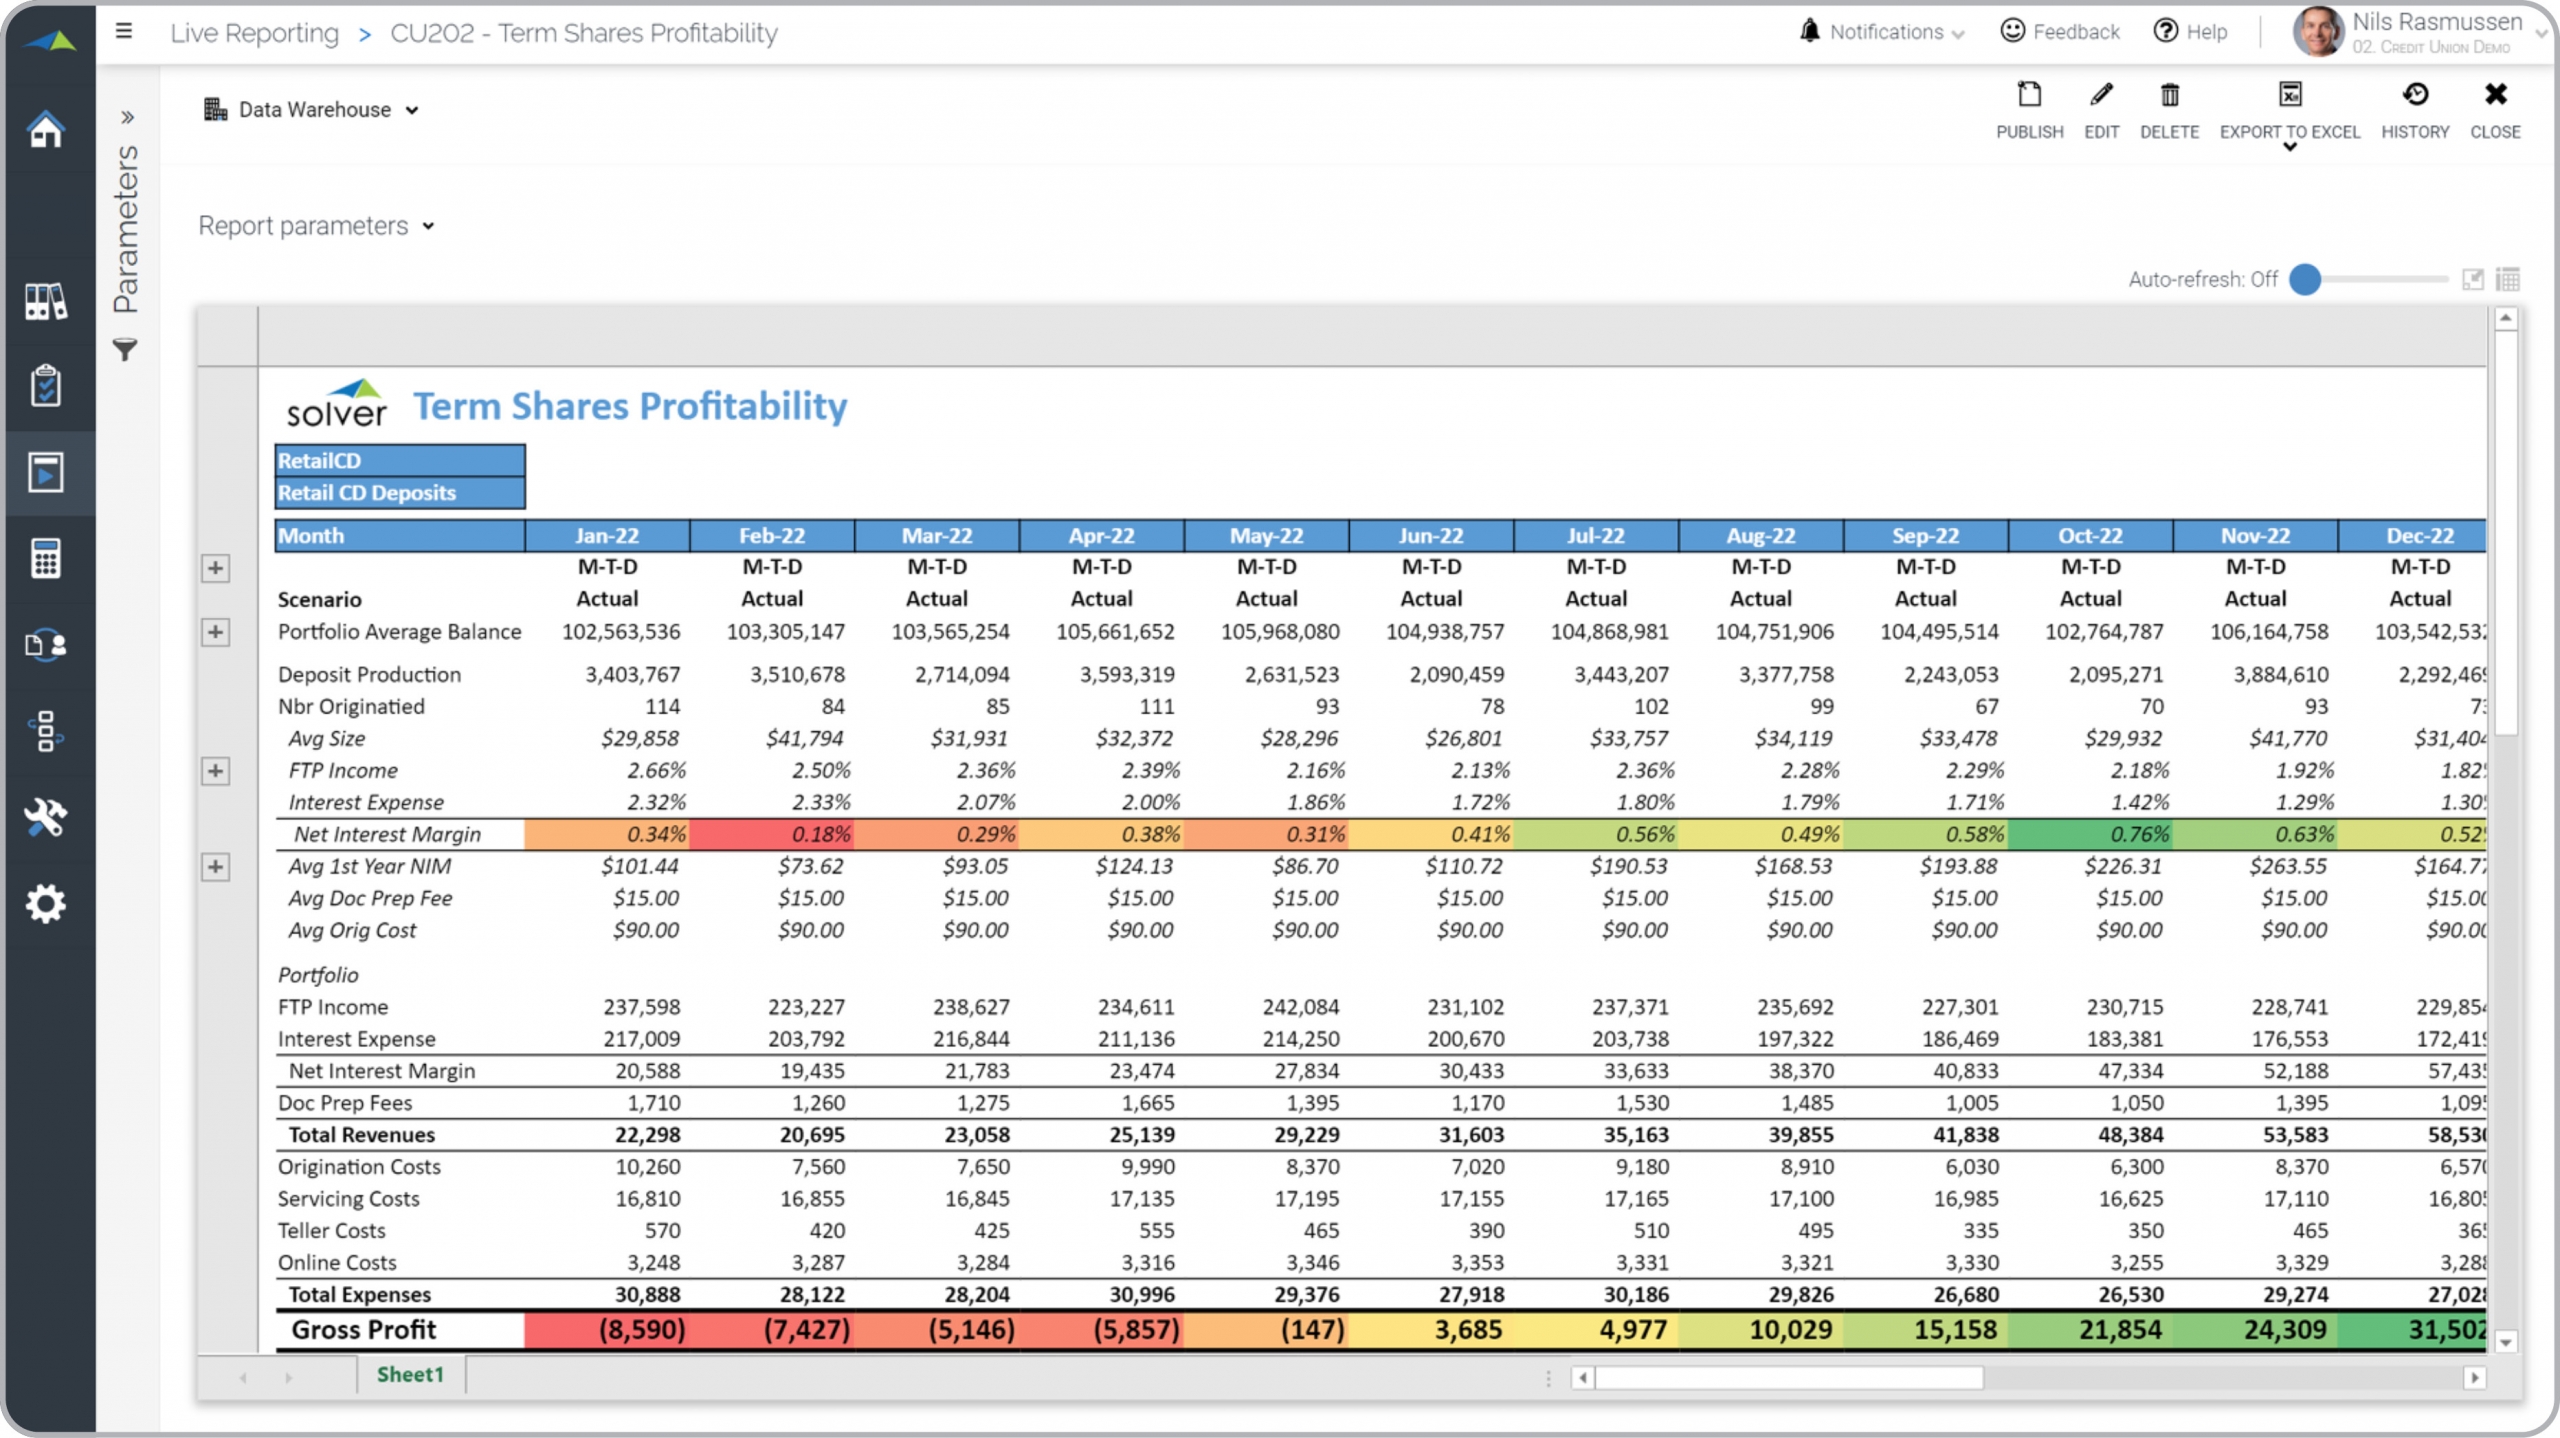
Term Shares Profitability Trend Report
? Term Shares Profitability Trend Reports are considered operational reports and are used by executives and managers to analyze monthly trends in term share metrics. Some of the main functionality in this type of report is that it dynamically lists the months of the year across the columns and loan metrics down the rows with a Gross Profit total at the bottom. Some of the key rows include: Portfolio average balance, Deposit production, Nbr origination, Average size, FTP Income, Interest Expense, Net Interest Margin, Average First Year NIM, Average Doc Prep Fee, Average Origination Cost, FTP Income, Interest Expense, Net Interest Margin, Servicing Costs, Teller costs, Online costs, Total expenses, and Gross Profit. The green, yellow and red exception colors help highlight months with high/low profitability. You find an example of this type of report below.
Purpose of
Term Shares Profitability Trend Reports Credit Unions use Term Shares Profitability Trend Reports to give leaders an easily understandable format to analyze monthly trends in term shares revenues, expenses and profitability. When used as part of good business practices in Production- and Financial Planning & Analysis (FP&A) departments, a company can improve its net profit and related term shares strategies, and it can reduce the chances that major exceptions or trends are not quickly discovered.
Example of a
Term Shares Profitability Trend Report Here is an example of a Term Shares Profitability Report with monthly trends in term shares metrics and profitability. [caption id="" align="alignnone" width="2560"]
 Example of a Term Shares Profitability Trend Report for Credit Unions[/caption] You can find hundreds of additional examples
here
Who Uses This Type of
Report
? The typical users of this type of report are: Executives, branch managers, finance leaders, loan managers, production managers.
Other Reports Often Used in Conjunction with
Term Shares Profitability Trend Reports Progressive Production- and Financial Planning & Analysis (FP&A) departments sometimes use several different Term Shares Profitability Trend Reports, along with detailed term shares reports, term shares portfolio dashboards, KPI dashboards, branch benchmarking reports, annual budgets, profit & loss trend reports, balance sheets and other management and control tools.
Where Does the Data for Analysis Originate From? The Actual (historical transactions) data typically comes from enterprise resource planning (ERP) systems like: Microsoft Dynamics 365 (D365) Finance, Microsoft Dynamics 365 Business Central (D365 BC), Microsoft Dynamics AX, Microsoft Dynamics NAV, Microsoft Dynamics GP, Microsoft Dynamics SL, Sage Intacct, Sage 100, Sage 300, Sage 500, Sage X3, SAP Business One, SAP ByDesign, Acumatica, Netsuite and others. In analyses where budgets or forecasts are used, the planning data most often originates from in-house Excel spreadsheet models or from professional corporate performance management (CPM/EPM) solutions.
What Tools are Typically used for Reporting, Planning and Dashboards? Examples of business software used with the data and ERPs mentioned above are:
Example of a Term Shares Profitability Trend Report for Credit Unions[/caption] You can find hundreds of additional examples
here
Who Uses This Type of
Report
? The typical users of this type of report are: Executives, branch managers, finance leaders, loan managers, production managers.
Other Reports Often Used in Conjunction with
Term Shares Profitability Trend Reports Progressive Production- and Financial Planning & Analysis (FP&A) departments sometimes use several different Term Shares Profitability Trend Reports, along with detailed term shares reports, term shares portfolio dashboards, KPI dashboards, branch benchmarking reports, annual budgets, profit & loss trend reports, balance sheets and other management and control tools.
Where Does the Data for Analysis Originate From? The Actual (historical transactions) data typically comes from enterprise resource planning (ERP) systems like: Microsoft Dynamics 365 (D365) Finance, Microsoft Dynamics 365 Business Central (D365 BC), Microsoft Dynamics AX, Microsoft Dynamics NAV, Microsoft Dynamics GP, Microsoft Dynamics SL, Sage Intacct, Sage 100, Sage 300, Sage 500, Sage X3, SAP Business One, SAP ByDesign, Acumatica, Netsuite and others. In analyses where budgets or forecasts are used, the planning data most often originates from in-house Excel spreadsheet models or from professional corporate performance management (CPM/EPM) solutions.
What Tools are Typically used for Reporting, Planning and Dashboards? Examples of business software used with the data and ERPs mentioned above are:
- Native ERP report writers and query tools
- Spreadsheets (for example Microsoft Excel)
- Corporate Performance Management (CPM) tools (for example Solver)
- Dashboards (for example Microsoft Power BI and Tableau)
- View 100’s of reporting, consolidations, planning, budgeting, forecasting and dashboard examples here
- View a Credit Union industry white paper and other industry-specific information here
- See how reports are designed in a modern report writer using a cloud-connected Excel add-in writer
- Discover how the Solver CPM solution delivers financial and operational reporting
- Discover how the Solver CPM solution delivers planning, budgeting and forecasting
- Watch demo videos of reporting, planning and dashboards
September 1, 2021
TAGS: Reporting, Solver, report writer, Microsoft, template, practice, Acumatica, Netsuite, Finance, credit union, planning, GP, fintech, Business Central, excel, ax, forecast, Budget, Dynamics 365, budgeting, bank, Cloud, Software, Tableau, SAP, example, best, Sage, BC, D365, NAV, Intacct, financial institution, CPM, report, branch, SL, Management, dynamics, Power BI, shares profitability, shares profitability report