
What is a
Safety Dashboard for Manufacturing Companies
? Safety-focused Dashboards are considered incident analysis tools and are used by Executives and Safety Managers to monitor safety-related metrics and trends. Some of the main functionality in this type of dashboard is that it provides KPIs and graphical trend analysis that can be viewed for different years and plants. The dashboard includes: 1) Monthly incident trend per employee per plant compared to the company (all plants) average, 2) Total number of monthly incidents and near incidents, 3) Incident avoidance quiz score versus company-wide score, 4) Metrics by plant with average number of employees, safety incidents reported, near incidents reported and incidents per employee (FTE), and 5) Metrics by month with headcount, safety incidents reported, near incidents reported, incidents per employee and incident avoidance quiz score. You find an example of this type of dashboard below.
Purpose of
Safety Dashboards Manufacturing companies use Safety Dashboards to analyze and improve safety at their plants. This includes benchmarking across plants. When used as part of good business practices in HR and operations departments, an organization can improve and speed up its safety records and workplace reputation, and it can reduce the chances that plant operations are disrupted due to safety-related issues.
Example of a
Safety Dashboard Here is an example of A Safety Dashboard for a manufacturing company. [caption id="" align="alignnone" width="2560"]
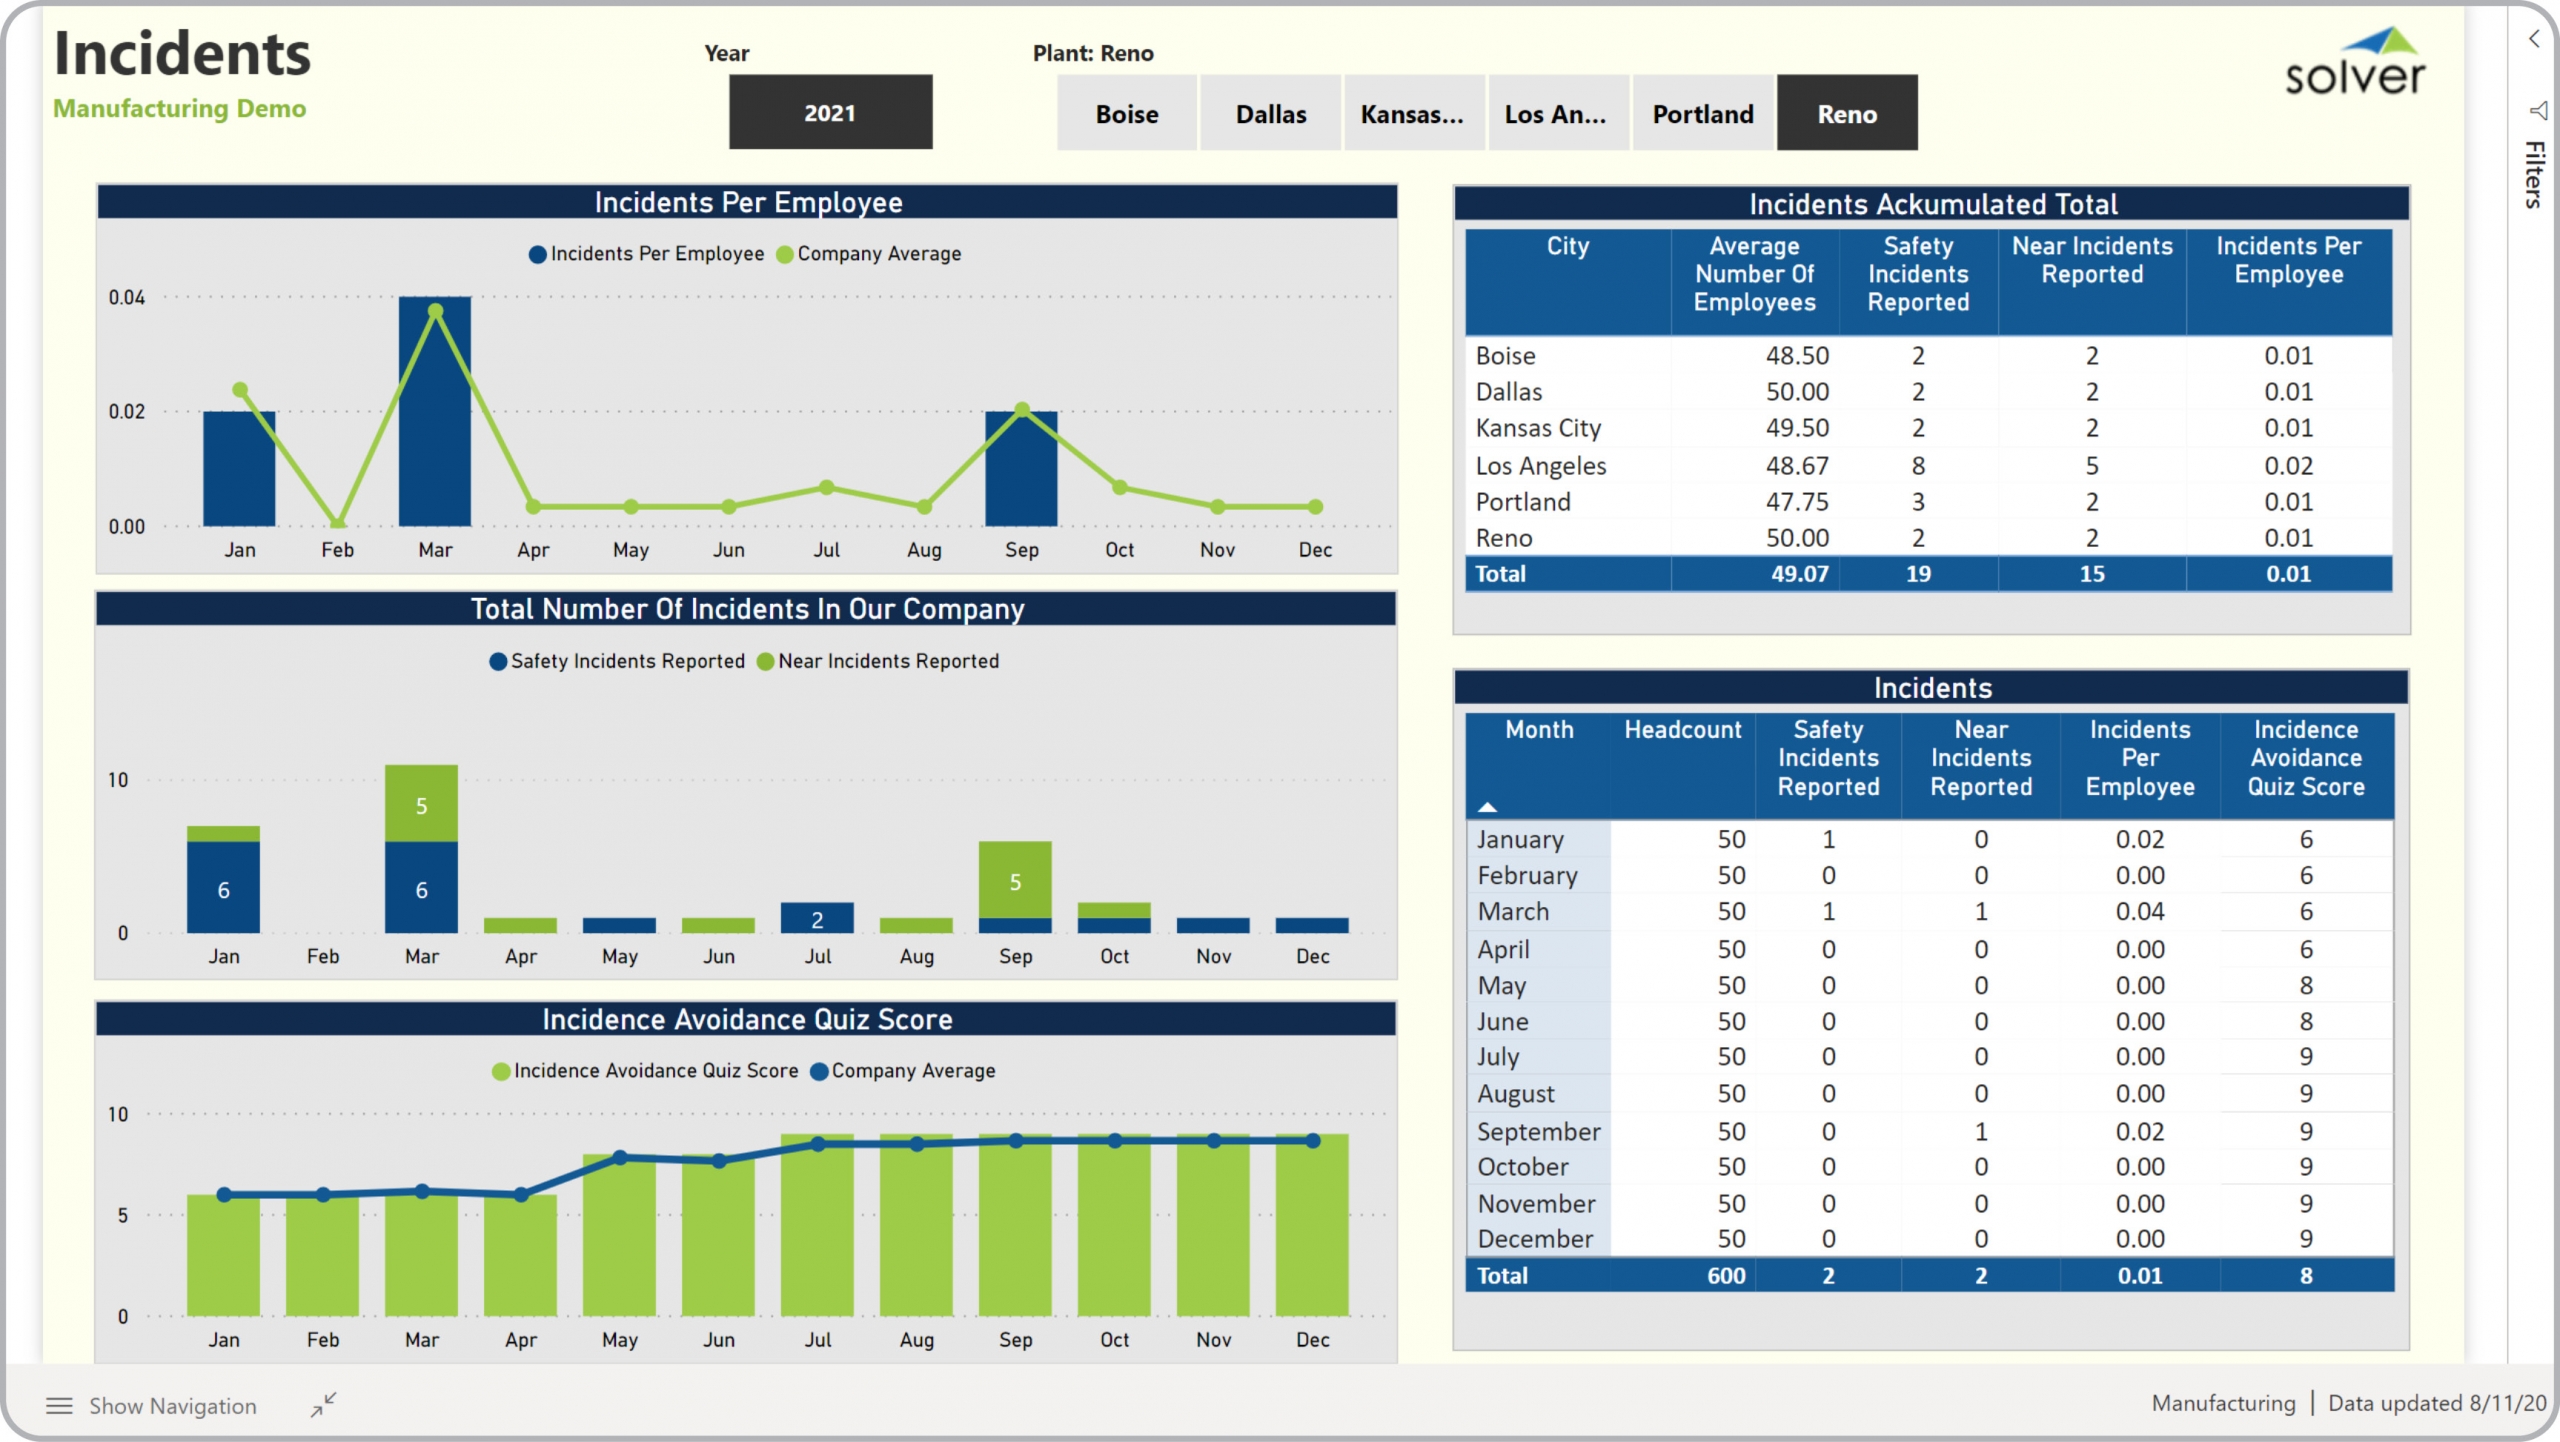 Example of a Safety Dashboard for Manufacturing Companies[/caption] You can find hundreds of additional examples
here
Who Uses This Type of
Dashboard
? The typical users of this type of dashboard are: Executives, analysts, plant managers, production managers, safety officers, HR managers.
Other Reports Often Used in Conjunction with
Safety Dashboards Progressive HR and operations departments sometimes use several different Safety Dashboards, along with incident reports, safety reports, HR reports, budget models with safety targets, human capital planning models and other management and control tools.
Where Does the Data for Analysis Originate From? The Actual (historical transactions) data typically comes from enterprise resource planning (ERP) systems like: Microsoft Dynamics 365 (D365) Finance, Microsoft Dynamics 365 Business Central (D365 BC), Microsoft Dynamics AX, Microsoft Dynamics NAV, Microsoft Dynamics GP, Microsoft Dynamics SL, Sage Intacct, Sage 100, Sage 300, Sage 500, Sage X3, SAP Business One, SAP ByDesign, Acumatica, Netsuite and others. In analyses where budgets or forecasts are used, the planning data most often originates from in-house Excel spreadsheet models or from professional corporate performance management (CPM/EPM) solutions.
What Tools are Typically used for Reporting, Planning and Dashboards? Examples of business software used with the data and ERPs mentioned above are:
Example of a Safety Dashboard for Manufacturing Companies[/caption] You can find hundreds of additional examples
here
Who Uses This Type of
Dashboard
? The typical users of this type of dashboard are: Executives, analysts, plant managers, production managers, safety officers, HR managers.
Other Reports Often Used in Conjunction with
Safety Dashboards Progressive HR and operations departments sometimes use several different Safety Dashboards, along with incident reports, safety reports, HR reports, budget models with safety targets, human capital planning models and other management and control tools.
Where Does the Data for Analysis Originate From? The Actual (historical transactions) data typically comes from enterprise resource planning (ERP) systems like: Microsoft Dynamics 365 (D365) Finance, Microsoft Dynamics 365 Business Central (D365 BC), Microsoft Dynamics AX, Microsoft Dynamics NAV, Microsoft Dynamics GP, Microsoft Dynamics SL, Sage Intacct, Sage 100, Sage 300, Sage 500, Sage X3, SAP Business One, SAP ByDesign, Acumatica, Netsuite and others. In analyses where budgets or forecasts are used, the planning data most often originates from in-house Excel spreadsheet models or from professional corporate performance management (CPM/EPM) solutions.
What Tools are Typically used for Reporting, Planning and Dashboards? Examples of business software used with the data and ERPs mentioned above are:
- Native ERP report writers and query tools
- Spreadsheets (for example Microsoft Excel)
- Corporate Performance Management (CPM) tools (for example Solver)
- Dashboards (for example Microsoft Power BI and Tableau)
- View 100’s of reporting, consolidations, planning, budgeting, forecasting and dashboard examples here
- View a Manufacturing white paper and other industry-specific information here
- See how reports are designed in a modern report writer using a cloud-connected Excel add-in writer
- Discover how the Solver CPM solution delivers financial and operational reporting
- Discover how the Solver CPM solution delivers planning, budgeting and forecasting
- Watch demo videos of reporting, planning and dashboards
April 3, 2021
TAGS: Reporting, Solver, plant, report writer, Microsoft, manufacturing, template, practice, Acumatica, visualization, Netsuite, Finance, planning, GP, dashboard, Business Central, hr, excel, ax, forecast, Budget, Employee, Dynamics 365, analysis, budgeting, labor, Cloud, Software, Tableau, SAP, example, best, Sage, BC, D365, NAV, Intacct, facility, CPM, report, SL, Management, dynamics, Power BI, safety, safety incidents, safety dashboard, incidents, occupational health