Profitability by Member Account Report for Credit Unions - Example, Uses
  • View Demo
  • Contact Us
  • EspañolEspañol
  • EnglishEnglish
  • FrançaisFrançais
  •  
  • GermanGerman
  •  
  • ItalianItalian
Solver Global
  • SOLUTIONS
    • Product Overview
      • Customer Success Stories
      • Vendor Comparison and ROI Tool
      • How To Buy
      • Training & Implementation
      • Compliance
    • SOLVER SUITE
      • Planning
      • Reporting
      • Dashboards
      • Data Warehouse
      • Data Integration
    • EXPERIENCE SOLVER
      • Solver Tour Central
      • Template Marketplace
      • Videos
      • White Papers
      • EBooks
      • Cloud Promotions
    • SOLUTIONS BY INDUSTRY
      • Nonprofit
      • Healthcare
      • Manufacturing
      • Distribution
      • All Industries
  • SERVICES
    • Overview
    • Consulting
    • Training
    • Support
    • Solver Community
  • PARTNERS
    • Overview
    • Find A Partner
    • Become A Partner
    • Technology Partner
    • Partner Portal
  • COMPANY
    • Company
    • Leadership
    • Careers
    • Awards
    • Press Releases
  • BLOG
  • EVENTS
    • All
    • Ascend 2022
  • CONTACT
    • Contact Support
    • Contact Us
  • Search
  • Menu

Profitability by Member Account Report for Credit Unions

Report, Budget, Forecast and Dashboard Template Glossary

What is an Account Profitability Report
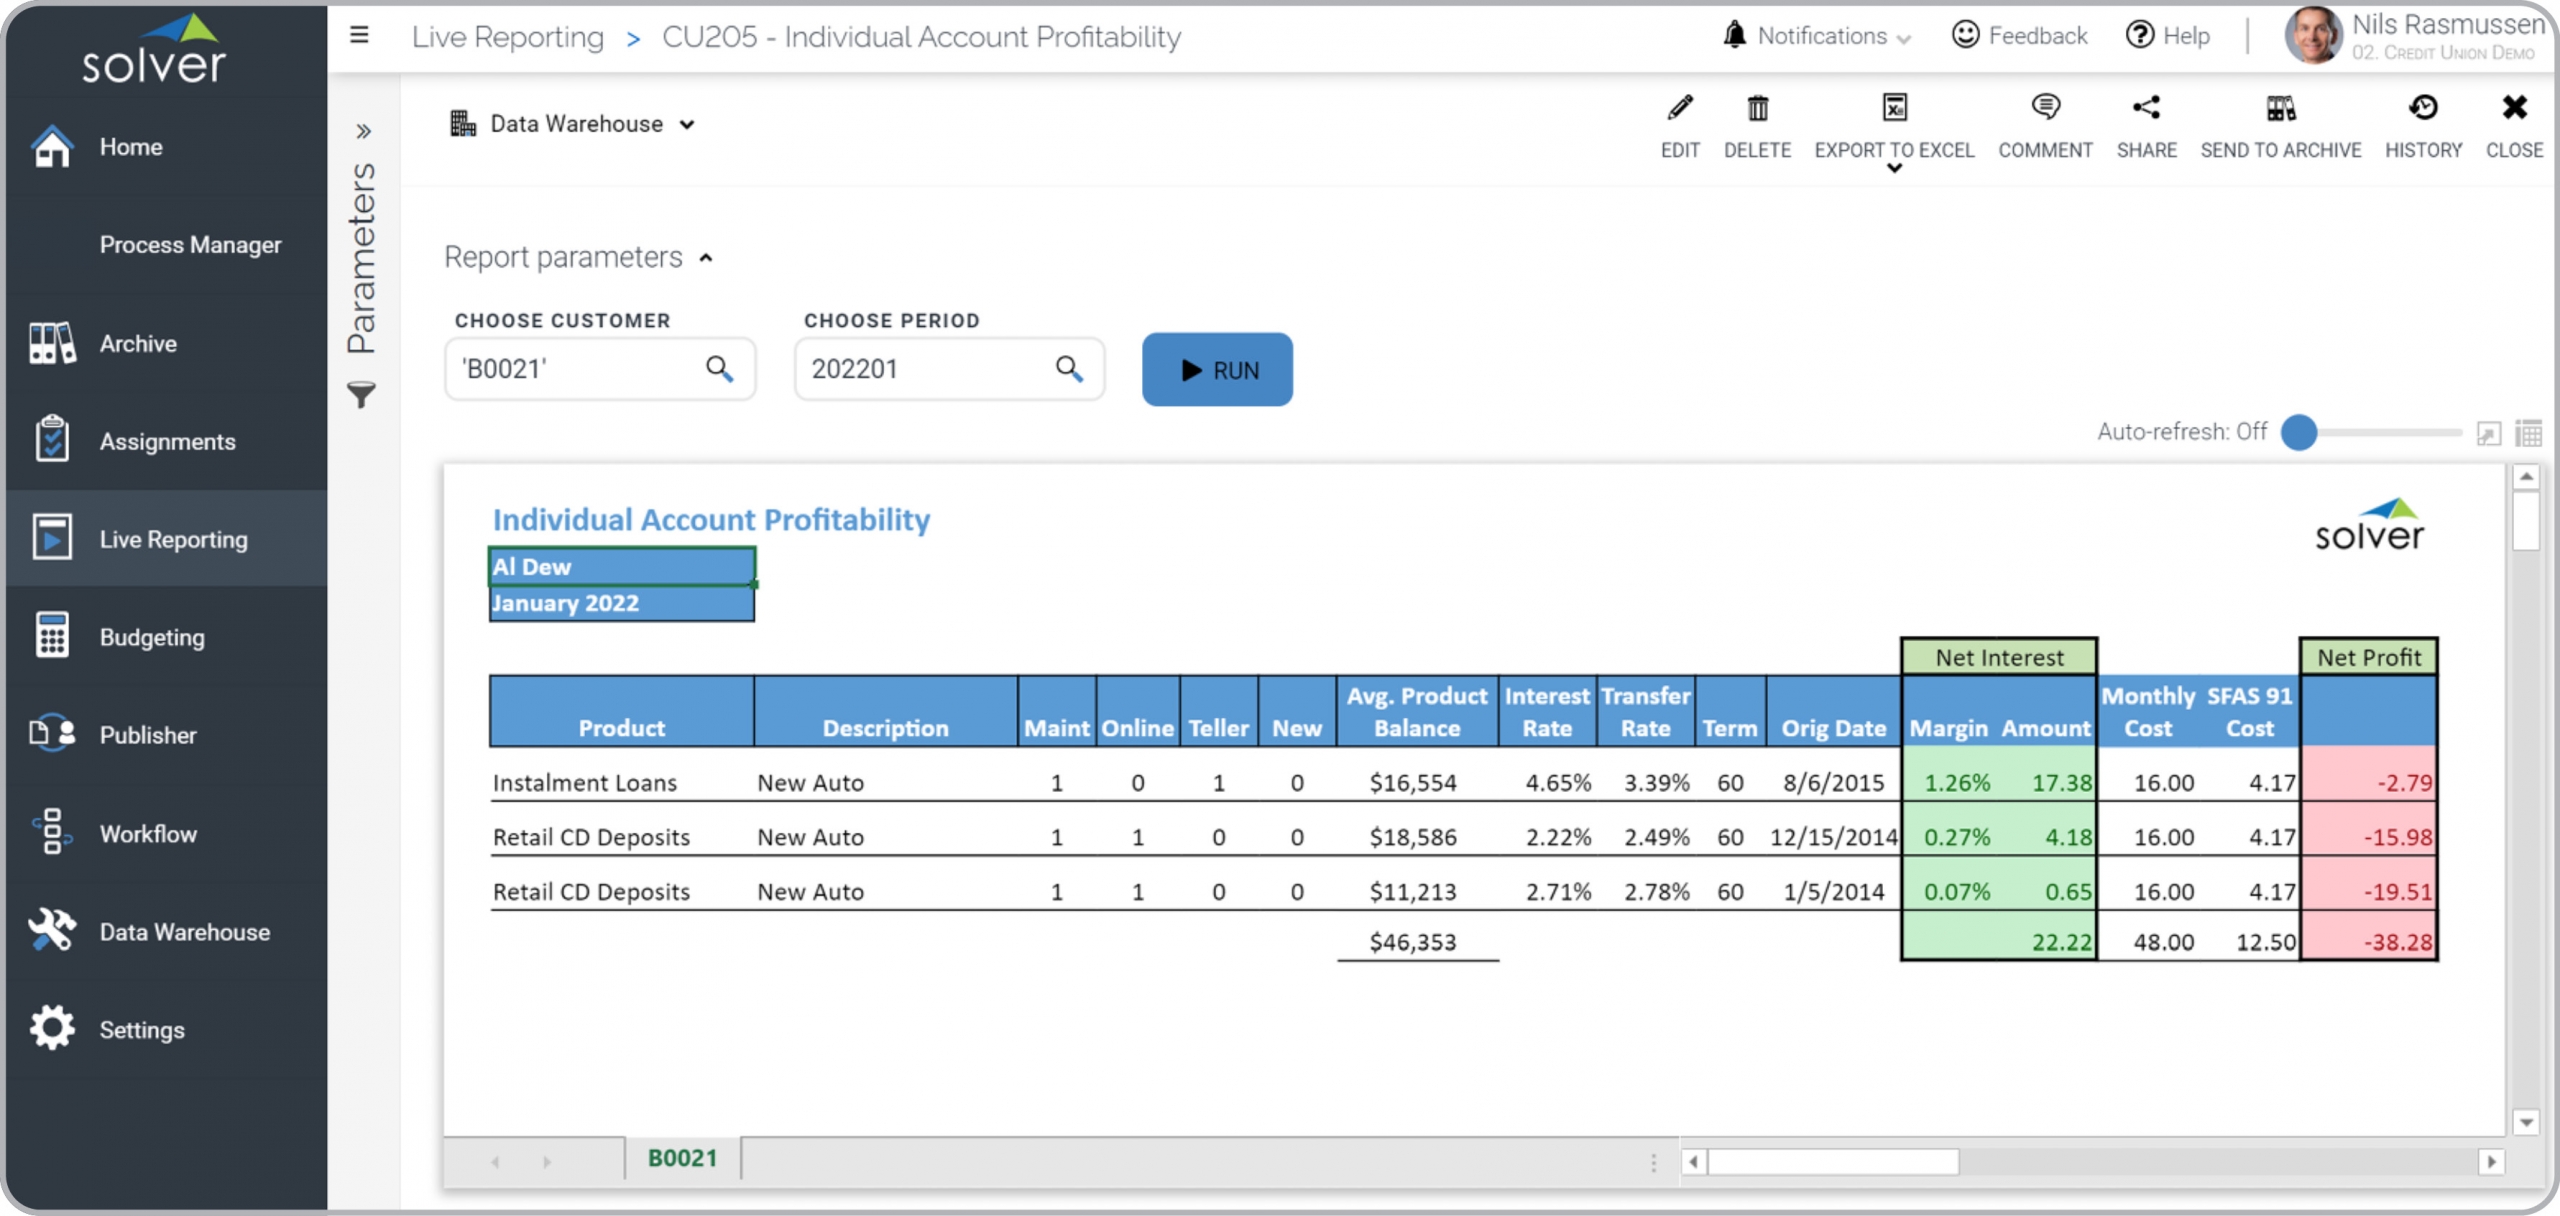
?

Account Profitability Reports are considered operational reports and are used by account executives and analysts to review income, expenses and profitability for individual member accounts. Some of the main functionality in this type of report is that it enables the user to select the member account and the period to see the profitability by product transaction and in total for the account. The rows display the product transaction balances and the columns include: Average product balance, Interest rate, Transfer rate, Term, Origination date, Interest margin and amount, Monthly cost, SFAS cost, and Net profit. You find an example of this type of report below.

Purpose of Account Profitability Profitability Reports

Credit Unions use Account Profitability Reports to give account managers an easy way to see how profitable a particular member account is. When used as part of good business practices in Production- and Account Management departments, a company can improve its profitability and account planning, and it can reduce the chances of uninformed member discussions leading to poor decisions and offerings.

Example of an Account Profitability Report

Here is an example of an Account Profitability Report with product detail as well as key revenue and expense metrics.

Example of a Profitability by Member Account Report for Credit Unions

Example of a Profitability by Member Account Report for Credit Unions

You can find hundreds of additional examples here

Who Uses This Type of Report?

The typical users of this type of report are: Account executives, production managers, branch managers, analysts.

Other Reports Often Used in Conjunction with Account Profitability Reports

Progressive Production- and Account Management departments sometimes use several different Account Profitability Reports, along with financial statements, annual budgets, KPI dashboards, Member dashboards and other management and control tools.

Where Does the Data for Analysis Originate From?

The Actual (historical transactions) data typically comes from member account systems and enterprise resource planning (ERP) systems like: Microsoft Dynamics 365 (D365) Finance, Microsoft Dynamics 365 Business Central (D365 BC), Microsoft Dynamics AX, Microsoft Dynamics NAV, Microsoft Dynamics GP, Microsoft Dynamics SL, Sage Intacct, Sage 100, Sage 300, Sage 500, Sage X3, SAP Business One, SAP ByDesign, Acumatica, Netsuite and others.

In analyses where budgets or forecasts are used, the planning data most often originates from in-house Excel spreadsheet models or from professional corporate performance management (CPM/EPM) solutions.

What Tools are Typically used for Reporting, Planning and Dashboards?

Examples of business software used with the data and ERPs mentioned above are:

  • Native ERP report writers and query tools
  • Spreadsheets (for example Microsoft Excel)
  • Corporate Performance Management (CPM) tools (for example Solver)
  • Dashboards (for example Microsoft Power BI and Tableau)

Corporate Performance Management (CPM) Cloud Solutions and More Examples

  • View 100’s of reporting, consolidations, planning, budgeting, forecasting and dashboard examples here
  • View a Credit Union industry white paper and other industry-specific information here
  • See how reports are designed in a modern report writer using a cloud-connected Excel add-in writer
  • Discover how the Solver CPM solution delivers financial and operational reporting
  • Discover how the Solver CPM solution delivers planning, budgeting and forecasting
  • Watch demo videos of reporting, planning and dashboards
September 2, 2021/by Nils R.
Tags: account, Acumatica, ax, bank, BC, best, branch, Budget, budgeting, Business Central, Cloud, CPM, credit union, customer, D365, dynamics, Dynamics 365, example, excel, Finance, financial institution, fintech, forecast, GP, Intacct, Management, member, Microsoft, NAV, Netsuite, planning, Power BI, practice, profitability, profitability by member account, profitability by product, report, report writer, reporting, Sage, SAP, SL, Software, Solver, Tableau, template, tools, top
Share this entry
  • Share on Facebook
  • Share on Twitter
  • Share on Pinterest
  • Share on LinkedIn
https://www.solverglobal.com/wp-content/uploads/2021/09/Industry_CreditUnion24-scaled-2.jpg 1216 2560 Nils R. https://www.solverglobal.com/wp-content/uploads/2019/10/solver-logo-final.png Nils R.2021-09-02 21:22:452021-09-03 18:13:14Profitability by Member Account Report for Credit Unions

High-Impact Ideas

  • All Examples
  • Accounts Receivable Report with Dynamic Aging Buckets
  • Expense Budget Input Form with Line Item Detail
  • Top-Down Profit & Loss Budget Form
  • Annual Budget KPI Report
  • Strategy and Goals Input Form
  • Strategic Initiatives Status Tracking and Accountability
  • Department Revenue and Expense Forecast Form
  • Payroll Forecast Assumption Input Form
  • Driver-based Payroll Forecast Template
  • Driver-based Profit & Loss “Break-back” Model
  • Driver-based Sales Forecast
  • Sales Forecast from CRM Pipeline
  • Subscription Revenue Forecast Example
  • Multi-Year Forecast Input Template
  • Budget Accuracy Report
  • Payroll Budget Assumption Input Form
  • Liquidity Risk Analysis Forecast Report
  • Payroll Budget Template
  • Capital Expense Budget Template
  • Travel & Entertainment Budget Template
  • Sales Budget by Sales Rep, Customer and Product – Example
  • Rolling 12 Month Budget Input Form Example
  • Marketing Campaign Budget Template
  • Vendor Expense Budget Input Form
  • Project Budgeting Template
  • Profit & Loss Budget Analysis Report
  • Personnel Headcount Budget Report
  • Cash Flow Budget Report
  • Monthly Profit & Loss Forecast Report
  • Monthly Balance Sheet Forecast Report
  • Monthly Cash Flow Forecast Model
  • Intercompany Matching Report
  • Consolidating Trial Balance
  • Profit & Loss Report with Exchange Rate Analysis
  • Trial Balance with Currency Analysis
  • Profit & Loss Report with Currency Analysis
  • Retained Earnings Rate Calculation Report
  • Intercompany Transaction Audit Report
  • Consolidated Profit & Loss Monthly Trend Report
  • Consolidating Profit & Loss Report
  • Consolidated Profit & Loss Monthly Variance Report
  • Consolidated Multi-level Profit & Loss Monthly Variance Report
  • Consolidating Year-to-Date Profit & Loss Report
  • Multi-company Account Analysis Report
  • Consolidating Balance Sheet
  • Consolidating Cash Flow Statement
  • Intercompany Elimination Input Form
  • Profit & Loss Variance Report with Companies in The Rows
  • Revenue and Expense Exception Report
  • Consolidated Accounts Receivable Report
  • Consolidated Accounts Payable Report
  • Profit & Loss Variance Report
  • Trended Balance Sheet Report
  • Rolling 13 Month Cash Flow Report
  • Trial Balance Monthly Trend Report
  • Trial Balance Variance Report
  • Rolling 13 Month Profit & Loss Report
  • Narrative Profit & Loss Report
  • Profit & Loss Variance Report with Expandable YTD columns
  • Monthly Profit & Loss Report with Budget and Forecast Variances
  • Profit & Loss Report with Charts and Modern Layout
  • Profit & Loss Report with Text Comment Column
  • Profit & Loss Report with Estimate versus Budget
  • Profit & Loss Report with Links to Supporting Sub-ledger Reports
  • Profit & Loss Report with Monthly Trend
  • Profit & Loss Report with Department Comparisons
  • Trended Profit & Loss Report for Current versus Last Year
  • Monthly Balance Sheet with Prior Month and Last Year Comparisons
  • Monthly Cash Flow Statement with Current and Prior Month Figures
  • Graphical Cash Flow Analysis Tool and Dashboard Report
  • Rolling Revenue Trend Analysis Dashboard
  • Cash, AR and Expense Trend Analysis Dashboard
  • Monthly Exception Report Focused on User Comments
  • Top 10 KPI Report with 13 Month Rolling Trend Analysis
  • KPI Alert Report
  • Strategic KPI Report
  • Detailed KPI Variance Report
  • Monthly Flash Report
  • Executive Briefing Card Report
  • Predictive Forecasting Based on Trend Analysis
  • Compensation & Headcount Variance Report
  • Departmental Allocation Report
  • Allocation Input Form
  • Event Budgeting and Forecasting Tools
  • Membership Budget for Nonprofit Organizations
  • Membership Forecast for Nonprofit Organizations
  • Expense Budget Assumptions for Healthcare Providers
  • Patient Revenue Budget for Healthcare Providers
  • Revenue Budget Assumptions for Healthcare Providers
  • Payroll Budget Model for Government Entities
  • Personnel Budget Assumptions for Government Entities
  • Non-commissioned Staff Payroll Budget for Retail Companies
  • Commissioned Staff Payroll Budget for Retail Companies
  • Direct Labor Cost by Manufacturing Process Report
  • Production Forecast for a Manufacturing Plant
  • Labor Forecast for a Manufacturing Plant
  • Employee Tax and Benefit Budget for a Retail Company
  • Subscription Revenue by Customer Report
  • Subscription Revenue by Product Report
  • Recurring Revenue and Churn Analysis Report
  • Quarterly Trend Report for Subscription Revenue
  • Subscription Revenue Trend by Customer Report
  • Multi-year Strategic Planning Model for Nonprofits
  • Personnel Budget Model for Healthcare Providers
  • Operating Expense Budget Model for Healthcare Providers
  • Capital Expense Budget for Healthcare Providers
  • Higher Education Budgeting – Target Adjustments and Assumptions
  • Higher Education Budgeting – Personnel Assumptions
  • Work Order Management Report for Manufacturing Plants
  • Open Orders by Item Report for Manufacturing Plants
  • Revenue Budget Model for State and Local Government
  • Expense Budget Model for State and Local Government
  • Profitability Dashboard
  • Financial KPI Dashboard
  • Budget Analysis and Review Dashboard
  • Cash Flow Simulation Dashboard
  • Liquidity Analysis Dashboard
  • Revenue Analysis Dashboard
  • Sales Dashboard
  • Department Expense Forecast for Nonprofit Organizations
  • Salary Budget Allocation to Grants for Nonprofits
  • Higher Education Budgeting – Classified Employee Payroll
  • Higher Education Budgeting – Unclassified Employee Payroll
  • Higher Education Budgeting – Review and Adjustments Example
  • Higher Education Budgeting – Expense Request Example
  • Higher Education Budgeting – Revenue Example
  • Weekly Sales Forecasting and Budgeting for a Retail Company
  • Sales Budget per Product for a Retail Company
  • Executive Dashboard for a Manufacturing Business
  • Capacity Utilization Dashboard with Manufacturing Plant Comparisons
  • Grants Overview and Analysis Report for Nonprofits
  • Grants Paid Report for Nonprofits
  • Sales Report by Store and Region for a Retail Company
  • Consolidating Profit & Loss Report for a Retail Company
  • Actual and Estimated Project Hours Report for a Technology Company
  • Project Performance Report for a Technology Company
  • Waterfall Recurring Revenue Report for a Technology Company
  • Helpdesk Call Analysis Report for a Technology Company
  • Product Sales Forecast for a Technology Company
  • Recurring Revenue Forecast Model for a Technology Company
  • Website Efficiency Report
  • Marketing Campaign Report with Cost and ROI Analysis
  • Marketing Campaign Analysis Report
  • Top Sales Opportunities KPI Report
  • Marketing Campaign Profitability Report
  • Lead Generation and Qualification Analysis Report
  • Lead Management Report Example
  • Sales Opportunity Report with Trend Analysis
  • Opportunity Analysis by Sales Person Report Example
  • Win Loss Sales Analysis Report
  • Estimated Revenue Per Sales Person Report
  • Win Loss Dashboard Report by Person, Deal Size and Industry
  • Customer Accounts Receivables (AR) Aging Report by Sales Person
  • Sales Order Detail Report Example
  • Sales and Opportunity Report with Customer Metrics
  • Example of Sales by Sales Person with Ranking and Trend Analysis Report
  • Product Sales with Ranking and Trend Analysis Report Example
  • Customer Segmentation and Analysis Report
  • CRM User Activity Report
  • CRM Data Quality Report
  • 13 Month Rolling Profit & Loss Report
  • Monthly Profit & Loss Variance Report with Visual KPI Analysis
  • Profit & Loss Report with Trend Analysis
  • Profit & Loss Report with Automated Full Year Estimate
  • Modern Balance Sheet Variance Report with KPIs
  • Trended Balance Sheet with KPIs
  • Cash Flow Variance Report with KPI Analysis
  • Working Capital Trend Analysis Report
  • Trial Balance Year-to-Date Trend Report
  • Trial Balance Monthly Trend Report
  • Workforce Compensation Report with Payroll Analysis
  • Travel and Entertainment Expense Analysis Report
  • Travel and Entertainment Departmental Analysis Report
  • Customer 360 Degree Analysis Report
  • Sales by Customer Transaction Detail Report
  • Credit Card Expense Analysis Report by Vendor
  • Credit Card Expense Report by Category
  • Credit Card Expenses by Employee and Type
  • Credit Card Expense Analysis Report by Vendor
  • Capital Expenditure Budget Report
  • Return on Investment Report for a Corporate Web-site
  • Competitor Trend Analysis Report
  • Competitor Benchmark Analysis Report
  • Benchmarking Your Own Company versus an Industry Average
  • Sales by Sales Person Analysis Report
  • Top 20 Customer Accounts Receivable (AR) Aging Report
  • Top 20 Vendor Accounts Payable (AP) Report
  • Accounts Payable Report with Dynamic Aging and Vendor Analysis
  • Membership Analysis Report
  • Revenue Dashboard for a Nonprofit Organization
  • Executive Dashboard for a Nonprofit Organization
  • Automated Narrative for Nonprofit Financial Statements
  • Statement of Cash Flow for a Nonprofit Organization
  • Statement of Activities for a Nonprofit Organization
  • Grant Dashboard for a Nonprofit Organization
  • Membership Dashboard for a Nonprofit Organization
  • Statistical Budget Model for Healthcare Providers
  • Monthly Billing Summary Report for Healthcare Providers
  • Revenue by Service Group Report for Healthcare Providers
  • Monthly Charges Summary Report for a Healthcare Provider
  • Monthly Billings, Charges and Collections Summary Report for a Healthcare Provider
  • Monthly Collections Summary Report for a Healthcare Provider
  • Monthly Collection Rate Report for a Healthcare Provider
  • Claims by Payor Report for a Healthcare Provider
  • Consolidated Profit & Loss Report for a Healthcare Provider
  • Statement of Operations for a Healthcare Provider
  • Profit & Loss Report with KPIs for a Healthcare Provider
  • Payroll Budget Report by Department for a Healthcare Provider
  • Materials Usage Variance Report for a Manufacturing Company
  • Materials Cost Analysis Report for a Manufacturing Plant
  • Direct Labor Safety Record Dashboard for a Manufacturing Company
  • Direct Labor Turnover Dashboard for a Manufacturing Company
  • Direct Labor Productivity Dashboard for a Manufacturing Company
  • New and Existing Customer Sales Dashboard for a Manufacturing Company
  • Equipment Maintenance Report for a Manufacturing Plant
  • Capacity Utilization Dashboard with Manufacturing Plant Comparisons
  • Yield Variance Report for a Manufacturing Company
  • Utilities Cost Dashboard for a Manufacturing Plant
  • Profit & Loss Variance Report for a Retail Company
  • Executive Dashboard for a Retail Company
  • Store Performance Dashboard for a Retail Company
  • Sales Report by Product and Store for a Retail Company
  • Product Dashboard for a Retail Company
  • Automated Forecast for New Retail Store Opening
  • Sales Trend by Product Class Report for a Retail Company
  • Product Sales Dashboard for a Distribution Company
  • Executive Dashboard for a Distribution Company
  • Sales Manager Dashboard for a Distribution Company
  • Customer Rating Dashboard for a Distribution Company
  • Customer Sales Dashboard for a Distribution Company
  • Transportation Carrier Monthly Trend Dashboard
  • Transportation Carrier Comparison Dashboard
  • Supplier KPI Dashboard for a Distribution Business
  • Monthly Trend Dashboard for a Distribution Center
  • Distribution Center Comparison Dashboard
  • Item Comparison Dashboard for a Distributor
  • Sales by Product Report for a Distribution Company
  • Sales by Customer Report for a Distribution Company
  • Profit & Loss Consolidation Report for a Distribution Company
  • Profit & Loss Variance Report for a Distribution Company
  • Inventory Analysis Report with Drill Down to Sales Orders
  • Higher Education Budgeting – Target Adjustments by Fund Example
  • Higher Education Budgeting – Salary Request by Fund Example
  • Higher Education Budgeting – Operating Expense Budget Request by Fund
  • Higher Education Budgeting – Allocations of Program Expenses to Funds
  • Higher Education Reporting – Revenue and Expenses with Remaining Budget
  • Higher Education Reporting – Monthly Trends in Revenues and Expenses
  • Higher Education Planning and Reporting – Comparison Between Current Year and Next Year Budgets
  • Higher Education Reporting – Actual versus Budget Payroll Variance Analysis
  • Higher Education Reporting – Student Detail Report
  • Higher Education Reporting – Enrollment by School Analysis
  • Higher Education Reporting – Grant Summary Report with Awards and Encumbrances
  • Higher Education Reporting – Intercampus Matching Report
  • Higher Education Revenue Dashboard
  • Higher Education – Student Enrollment Dashboard
  • Higher Education Grant Dashboard
  • Sales Opportunity Recommendation Dashboard
  • Marketing Budget Simulation Dashboard
  • Sales Budget Simulation Dashboard
  • Budget Detail Dashboard Example
  • Financial KPI Dashboard for Mobile Phones
  • Revenue KPI Dashboard for Mobile Phone Users
  • Profitability KPI Dashboard for Mobile Phones
  • CECL Reporting for Credit Unions – Analysis by Call Code
  • Loan Performance Dashboard for Banks
  • CFO Dashboard for Banks
  • Executive Dashboard for Banks
  • Trended Balance Sheet Report for Banks
  • Trended Income Statement for Banks
  • Product KPI Report for Banks
  • Securities and GL Reconciliation Report for Banks
  • Expense Variance Report for Banks
  • Trended Regulatory Report for Banks
  • Securities Summary Portfolio Report for Banks
  • Deposit and GL Reconciliation Report for Banks
  • Loan and GL Reconciliation Report for Banks
  • Balanced Scorecard Report for Bank Branches
  • Securities by Category Report for Banks
  • Trended Securities Summary Report for Banks
  • Certificates of Deposit Production Trend Report for Banks
  • Loan Production Trend Report for Banks
  • Yield and Rate Analysis Report by Bank Branch
  • Balance Sheet Report for Bank Branches
  • Income Statement Report for Bank Branches
  • Consolidated Statement of Income Call Report for Banks
  • Top Ten Customers by Profitability Report for Banks
  • New Customer Acquisition Report for Banks
  • Profitability by Customer Report for Banks
  • Profitability by Customer Account Report for Banks
  • Term Deposit Profitability Trend Report for Banks
  • Loan Profitability Trend Report for Banks
  • Using Interactive Dashboard Navigation Menus to Simplify Financial Analysis
  • Using Balance Sheet Budget Dashboards to Streamline the Planning Process
  • Using Balance Sheet Exception Dashboards to Streamline the Monthly Analysis Process
  • Using Balance Sheet Simulation Dashboards to Streamline the Modelling and Forecasting Process
  • Using Balance Sheet Variance Dashboards to Streamline the Monthly Analysis Process
  • Using Expense Budget Dashboards to Streamline the Planning Process
  • Using Expense Exception Dashboards to Streamline the Monthly Analysis Process
  • Using Expense Simulation Dashboards to Streamline the Modelling and Forecasting Process
  • Using Expense Variance Dashboards to Streamline the Monthly Analysis Process
  • Using Financial KPI Variance Dashboards to Streamline the Monthly Analysis Process
  • Using KPI Simulation Dashboards to Streamline the Modelling and Forecasting Process
  • Using Profit Margin Budget Dashboards to Streamline the Planning Process
  • Using Profit Margin Variance Dashboards to Streamline the Monthly Analysis Process
  • Using Profit Simulation Dashboards to Streamline the Modelling and Forecasting Process
  • Using Profitability Exception Dashboards to Streamline the Monthly Analysis Process
  • Using Revenue Budget Dashboards to Streamline the Planning Process
  • Using Revenue Dashboards with Trends and Variances to Streamline the Monthly Reporting Process
  • Using Revenue Exception Dashboards to Streamline the Monthly Analysis Process
  • Using Revenue Simulation Dashboards to Streamline the Modelling and Forecasting Process
  • Using Revenue Variance Dashboards to Streamline the Monthly Analysis Process
  • Using Expense Dashboard with Trends and Variances to Streamline the Monthly Reporting Process
  • Using Profitability Dashboards with Trends and Variances to Streamline the Monthly Reporting Process
  • Using Balance Sheet Dashboards with Variance Analysis to Streamline the Monthly Reporting Process
  • Using KPI Dashboard with Trends and Variances to Streamline the Monthly Reporting Process
  • Using 24 Month Revenue Trend Dashboards to Streamline the Monthly Reporting Process
  • Using 24 Month Expense Trend Dashboards to Streamline the Monthly Reporting Process
  • Using 24 Month Profitability Trend Dashboards to Streamline the Monthly Reporting Process
  • Using 24 Month Balance Sheet Trend Dashboards to Streamline the Monthly Reporting Process
  • Using 24 Month KPI Trend Dashboards to Streamline the Monthly Reporting Process
  • Using 36 Month Revenue Trend Dashboards to Streamline the Monthly Reporting Process
  • Using 36 Month Expense Trend Dashboards to Streamline the Monthly Reporting Process
  • Using 36 Month Profitability Trend Dashboards to Streamline the Monthly Reporting Process
  • Using 36 Month Balance Sheet Trend Dashboards to Streamline the Monthly Reporting Process
  • Using 36 Month KPI Trend Dashboards to Streamline the Monthly Reporting Process
  • Using 48 Month Revenue Trend Dashboards to Streamline the Monthly Reporting Process
  • Using 48 Month Expense Trend Dashboards to Streamline the Monthly Reporting Process
  • Using 48 Month Profitability Trend Dashboards to Streamline the Monthly Reporting Process
  • Using 48 Month Balance Sheet Trend Dashboards to Streamline the Monthly Reporting Process
  • Using 48 Month KPI Trend Dashboards to Streamline the Monthly Reporting Process
  • Using 8 Quarter Rolling Revenue Dashboards to Streamline the Monthly Reporting Process
  • Using 8 Quarter Rolling Expense Dashboards to Streamline the Monthly Reporting Process
  • Using 8 Quarter Rolling Profit Margin Dashboards to Streamline the Monthly Reporting Process
  • Using 8 Quarter Rolling Balance Sheet Dashboards to Streamline the Monthly Reporting Process
  • Using 8 Quarter Rolling KPI Dashboards to Streamline the Monthly Reporting Process
  • Using Revenue Comparison and Consolidation Dashboards to Streamline the Monthly Reporting Process
  • Using Expense Comparison Dashboards to Streamline the Monthly Reporting and Consolidations Process
  • Using Profitability Comparison Dashboards to Streamline the Monthly Reporting Process
  • Using Balance Sheet Comparison Dashboards to Streamline the Monthly Reporting Process
  • Using KPI Comparison Dashboards to Streamline the Monthly Reporting Process
  • Using Revenue Benchmarking Dashboards to Streamline the Monthly Reporting Process
  • Using Expense Benchmarking Dashboards to Streamline the Monthly Reporting Process
  • Using Profitability Benchmarking Dashboards to Streamline the Monthly Reporting Process
  • Using KPI Benchmarking Dashboards to Streamline the Monthly Reporting Process
  • Using the Balance Sheet with Last Year Variances Report to Streamline the Monthly Reporting Process
  • Using Consolidating Balance Sheet Reports to Streamline the Monthly Reporting Process
  • Using Consolidating Profit & loss Reports to Streamline the Monthly Reporting Process
  • Using Trial Balance Variance Reports to Streamline the Monthly Reporting Process
  • Using Profit & Loss Variance Reports to Streamline the Monthly Reporting Process
  • Using a P&L Report with Automated Full Year Estimates to Streamline the Monthly Reporting Process
  • Using P&L Reports with Forecasts and Budgets to Streamline the Monthly Reporting Process
  • Using Rolling 13 Month P&L Trend Reports to Streamline the Monthly Reporting Process
  • Using P&L Summary Reports with Monthly and by Quarterly Details to Streamline the Monthly Reporting Process
  • Using P&L Consolidation Reports with Breakdown by Company to Streamline the Monthly Reporting Process
  • Using Balance Sheets with Comparison to Prior Year and Variances to Streamline the Monthly Reporting Process
  • Using Balance Sheet Trend Reports to Streamline the Monthly Reporting Process
  • Using Profit & Loss Top Down Driver-based Forecasts to Streamline the Planning Process
  • Using web-based P&L Budgeting Forms to Streamline the Annual Planning Process
  • Using Top 20 Vendor Payables Reports to Streamline the Expense Analysis Process
  • Using AP Detail by Vendor Reports to Streamline the Expense Analysis Process
  • Using AP Trend Reports by Vendor to Streamline the Vendor Expense Analysis Process
  • Using AP Detail Reports with Drill-down to Gorilla Expense to Streamline the Vendor Expense Analysis Process
  • Using Accounts Receivable Detail Reports to Streamline the AR Aging Analysis Process
  • Using 8 Quarter Rolling Profit & Loss Reports to Streamline the Monthly Reporting Process
  • Using Opening Balance Roll Forward Balance Sheet Reports to Streamline the Year-end Close Process
  • Using Opening Balance Roll Forward Profit & Loss Reports to Streamline the Year-end Close Process
  • Using Graphical Revenue Reports with Actual and Budget Comparisons to Streamline the Monthly Analysis Process
  • Using Revenue Analysis with Quarterly Actual and Budget Comparisons to Streamline the Quarterly Reporting Process
  • Using Operating Expense Analysis to Streamline the Monthly Reporting and Analysis Process
  • Using Rolling 10 Quarter Revenue Analysis to Streamline the Quarterly Reporting Process
  • Using Multi-year Revenue Trend Analysis to Streamline the Annual Reporting and Budgeting Process
  • Using Profitability Analysis to Streamline the Monthly Reporting Process
  • Using Asset & Liability Analysis with Variances and Trends to Streamline the Monthly Reporting Process

Products & Services

  • Overview of Suite
  • Videos & More
  • Solutions By Industry
  • Data Integration
  • Consulting

Partners

  • Overview
  • Find a Partner
  • Become A Partner
  • Technology Partner
  • Partner Portal

Company

  • Company
  • Leadership
  • Events
  • Press Releases
  • Awards & Recognitions
  • Blog

Contact Us

  • Directory
  • Make Payment
  • Support
  • Careers
  • Order Books
  • Sitemap
  • EspañolEspañol
  • EnglishEnglish
  • FrançaisFrançais
  • GermanGerman
  • ItalianItalian
© Copyright 2022, Solver All rights reserved.  Legal | Privacy
  • QuickStart and Template Marketplace Overview (2 min)
  • QuickStart and Template Marketplace Setup (10 min)
Solver Recognized as Leader in Corporate Performance Management for Fall 20... Microsoft U.S. Digital Transformation Academy
Scroll to top
We use cookies on our website to give you the most relevant experience by remembering your preferences and repeat visits. By clicking “Accept Allâ€, you consent to the use of ALL the cookies. However, you may visit "Cookie Settings" to provide a controlled consent.
Cookie SettingsAccept All
Manage consent

Privacy Overview

This website uses cookies to improve your experience while you navigate through the website. Out of these, the cookies that are categorized as necessary are stored on your browser as they are essential for the working of basic functionalities of the website. We also use third-party cookies that help us analyze and understand how you use this website. These cookies will be stored in your browser only with your consent. You also have the option to opt-out of these cookies. But opting out of some of these cookies may affect your browsing experience.
Necessary
Always Enabled
Necessary cookies are absolutely essential for the website to function properly. These cookies ensure basic functionalities and security features of the website, anonymously.
CookieDurationDescription
cookielawinfo-checkbox-analytics11 monthsThis cookie is set by GDPR Cookie Consent plugin. The cookie is used to store the user consent for the cookies in the category "Analytics".
cookielawinfo-checkbox-functional11 monthsThe cookie is set by GDPR cookie consent to record the user consent for the cookies in the category "Functional".
cookielawinfo-checkbox-necessary11 monthsThis cookie is set by GDPR Cookie Consent plugin. The cookies is used to store the user consent for the cookies in the category "Necessary".
cookielawinfo-checkbox-others11 monthsThis cookie is set by GDPR Cookie Consent plugin. The cookie is used to store the user consent for the cookies in the category "Other.
cookielawinfo-checkbox-performance11 monthsThis cookie is set by GDPR Cookie Consent plugin. The cookie is used to store the user consent for the cookies in the category "Performance".
viewed_cookie_policy11 monthsThe cookie is set by the GDPR Cookie Consent plugin and is used to store whether or not user has consented to the use of cookies. It does not store any personal data.
Functional
Functional cookies help to perform certain functionalities like sharing the content of the website on social media platforms, collect feedbacks, and other third-party features.
Performance
Performance cookies are used to understand and analyze the key performance indexes of the website which helps in delivering a better user experience for the visitors.
Analytics
Analytical cookies are used to understand how visitors interact with the website. These cookies help provide information on metrics the number of visitors, bounce rate, traffic source, etc.
Advertisement
Advertisement cookies are used to provide visitors with relevant ads and marketing campaigns. These cookies track visitors across websites and collect information to provide customized ads.
Others
Other uncategorized cookies are those that are being analyzed and have not been classified into a category as yet.
SAVE & ACCEPT

Don’t miss Solver’s user conference – Ascend 2022 registration is open!

Got it!
X