
What is
a
Profit & Loss Report with Exchange Rate Analysis
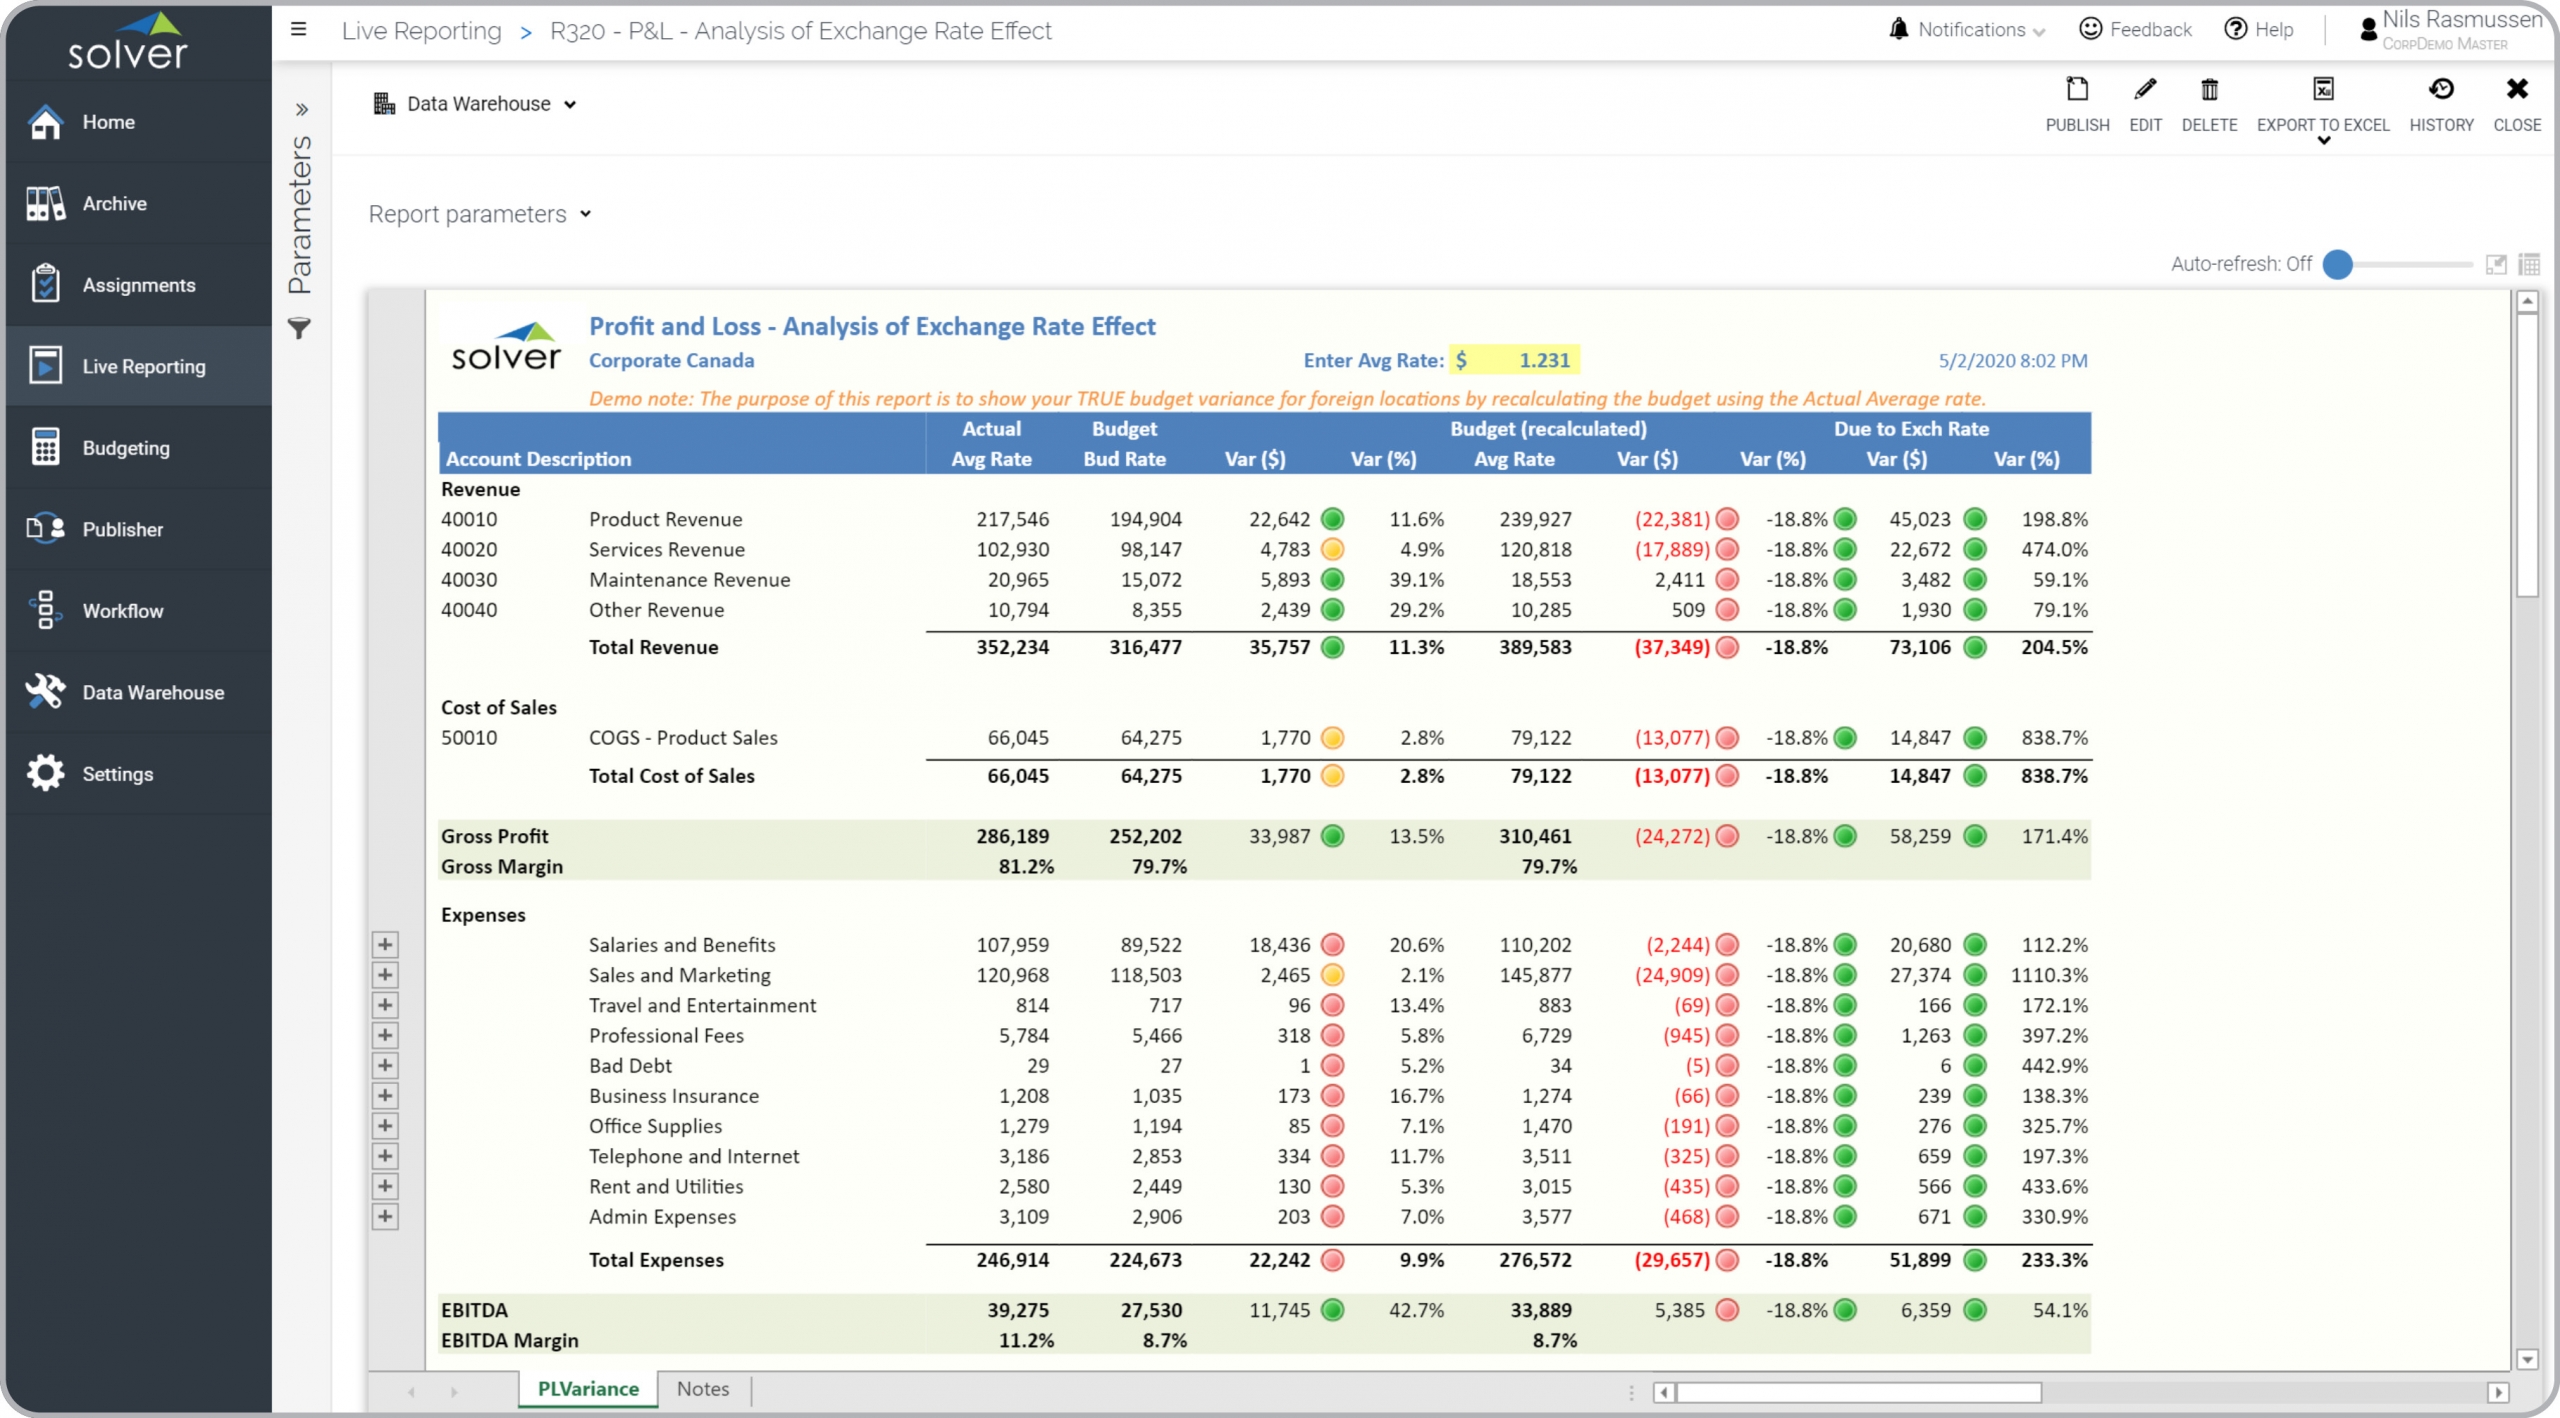
? Profit & Loss Currency Reports are considered month end consolidation tools and are used by CFOs and Group Managers to determine the impact of actual versus budget exchange rates on results. A key functionality in this type of financial report automatically re-calculates the Budget to use the same rate as the Actual data. Managers can directly compare the regular budget variance (at the budget rate) with the recalculated budget (at the actual rate). Managers can then see how much of their actual to budget variance was purely because of differences in exchange rates, and how much was actually due to the company's performance. You will find an example of this type of financial report below.
Purpose of
Profit & Loss Currency Analysis Reports Companies and organizations use Profit & Loss Currency Analysis Reports to easily determine true subsidiary performance versus good (or bad) luck with actual versus budget exchange rates. When used as part of good business practices in a Finance & Accounting Department, a company can improve its ability to see true performance issues versus results caused by external forces such as exchange rates. A company can also reduce the risk that important problems go undetected.
Profit & Loss Currency Analysis Report
Example Here is an example of a Profit & Loss Currency Analysis report. [caption id="" align="alignnone" width="2560"]
 Profit & Loss with Exchange Rate Analysis Report Example[/caption] You can find hundreds of additional examples
here.
Who Uses This Type of
Financial Report
? The typical users of this type of financial report are: CFOs and Group Managers.
Other
Financial Report
s Often Used in Conjunction with
Profit & Loss Currency Analysis Reports Progressive Finance & Accounting Departments sometimes use several different Profit & Loss Currency Analysis Reports, along with balance sheets, cash flow reports and other management and control tools.
Where Does the Data for Analysis Originate From? The Actual (historical transactions) data typically comes from enterprise resource planning (ERP) systems like: Microsoft Dynamics 365 (D365) Finance, Microsoft Dynamics 365 Business Central (D365 BC), Microsoft Dynamics AX, Microsoft Dynamics NAV, Microsoft Dynamics GP, Microsoft Dynamics SL, Sage Intacct, Sage 100, Sage 300, Sage 500, Sage X3, SAP Business One, SAP ByDesign, Acumatica, Netsuite and others. In analyses where budgets or forecasts are used, the planning data most often originates from in-house Excel spreadsheet models or from professional corporate performance management (CPM/EPM) solutions.
What Tools are Typically used for Reporting, Planning and Dashboards? Examples of business software used with the data and ERPs mentioned above are:
Profit & Loss with Exchange Rate Analysis Report Example[/caption] You can find hundreds of additional examples
here.
Who Uses This Type of
Financial Report
? The typical users of this type of financial report are: CFOs and Group Managers.
Other
Financial Report
s Often Used in Conjunction with
Profit & Loss Currency Analysis Reports Progressive Finance & Accounting Departments sometimes use several different Profit & Loss Currency Analysis Reports, along with balance sheets, cash flow reports and other management and control tools.
Where Does the Data for Analysis Originate From? The Actual (historical transactions) data typically comes from enterprise resource planning (ERP) systems like: Microsoft Dynamics 365 (D365) Finance, Microsoft Dynamics 365 Business Central (D365 BC), Microsoft Dynamics AX, Microsoft Dynamics NAV, Microsoft Dynamics GP, Microsoft Dynamics SL, Sage Intacct, Sage 100, Sage 300, Sage 500, Sage X3, SAP Business One, SAP ByDesign, Acumatica, Netsuite and others. In analyses where budgets or forecasts are used, the planning data most often originates from in-house Excel spreadsheet models or from professional corporate performance management (CPM/EPM) solutions.
What Tools are Typically used for Reporting, Planning and Dashboards? Examples of business software used with the data and ERPs mentioned above are:
- Native ERP report writers and query tools
- Spreadsheets (for example Microsoft Excel)
- Corporate Performance Management (CPM) tools (for example Solver)
- Dashboards (for example Microsoft Power BI and Tableau)
- View 100’s of reporting, consolidations, planning, budgeting, forecasting and dashboard examples here
- Discover how the Solver CPM solution delivers financial and operational reporting
- Discover how the Solver CPM solution delivers planning, budgeting and forecasting
- Watch demo videos of reporting, planning and dashboards
July 7, 2020
TAGS: Reporting, Solver, report writer, Microsoft, consolidation, template, practice, Acumatica, Netsuite, Finance, GP, Business Central, excel, ax, income statement, budgeting, Cloud, Software, Tableau, SAP, example, best, Sage, BC, P&L, D365, NAV, Intacct, CPM, report, SL, Management, dynamics, Power BI, rate, currency, effect, exchange