
What is a
Profit & Loss Variance Report
? Profit & Loss (P&L) variance reports are considered essential monthly financial tools and are used by CFOs and executives to analyze monthly and year-to-date (YTD) results. Some of the main functionality in this type of report is that it can be run for any given period and will dynamically list year-to-date and monthly figures with actual and prior year with variances. Exception highlights shows high and low variances. The YTD columns can be expanded to see each individual period with its revenues and expenses. You find an example of this type of report below.
Purpose of
P&L Variance Reports Sports organizations use P&L Variance Reports to have a clear picture of revenues, expenses, margins and profitability at any time during the year. When used as part of good business practices in Executive and Financial Planning & Analysis (FP&A) departments, an organization can improve its performance analysis and speed up decision-making, and it can reduce the chances that managers lack real-time financial insight to drive their planning and decision processes.
Example of a
P&L Variance Report Here is an example of a P&L Variance Report with current period and year-to-date results with variances. [caption id="" align="alignnone" width="2560"]
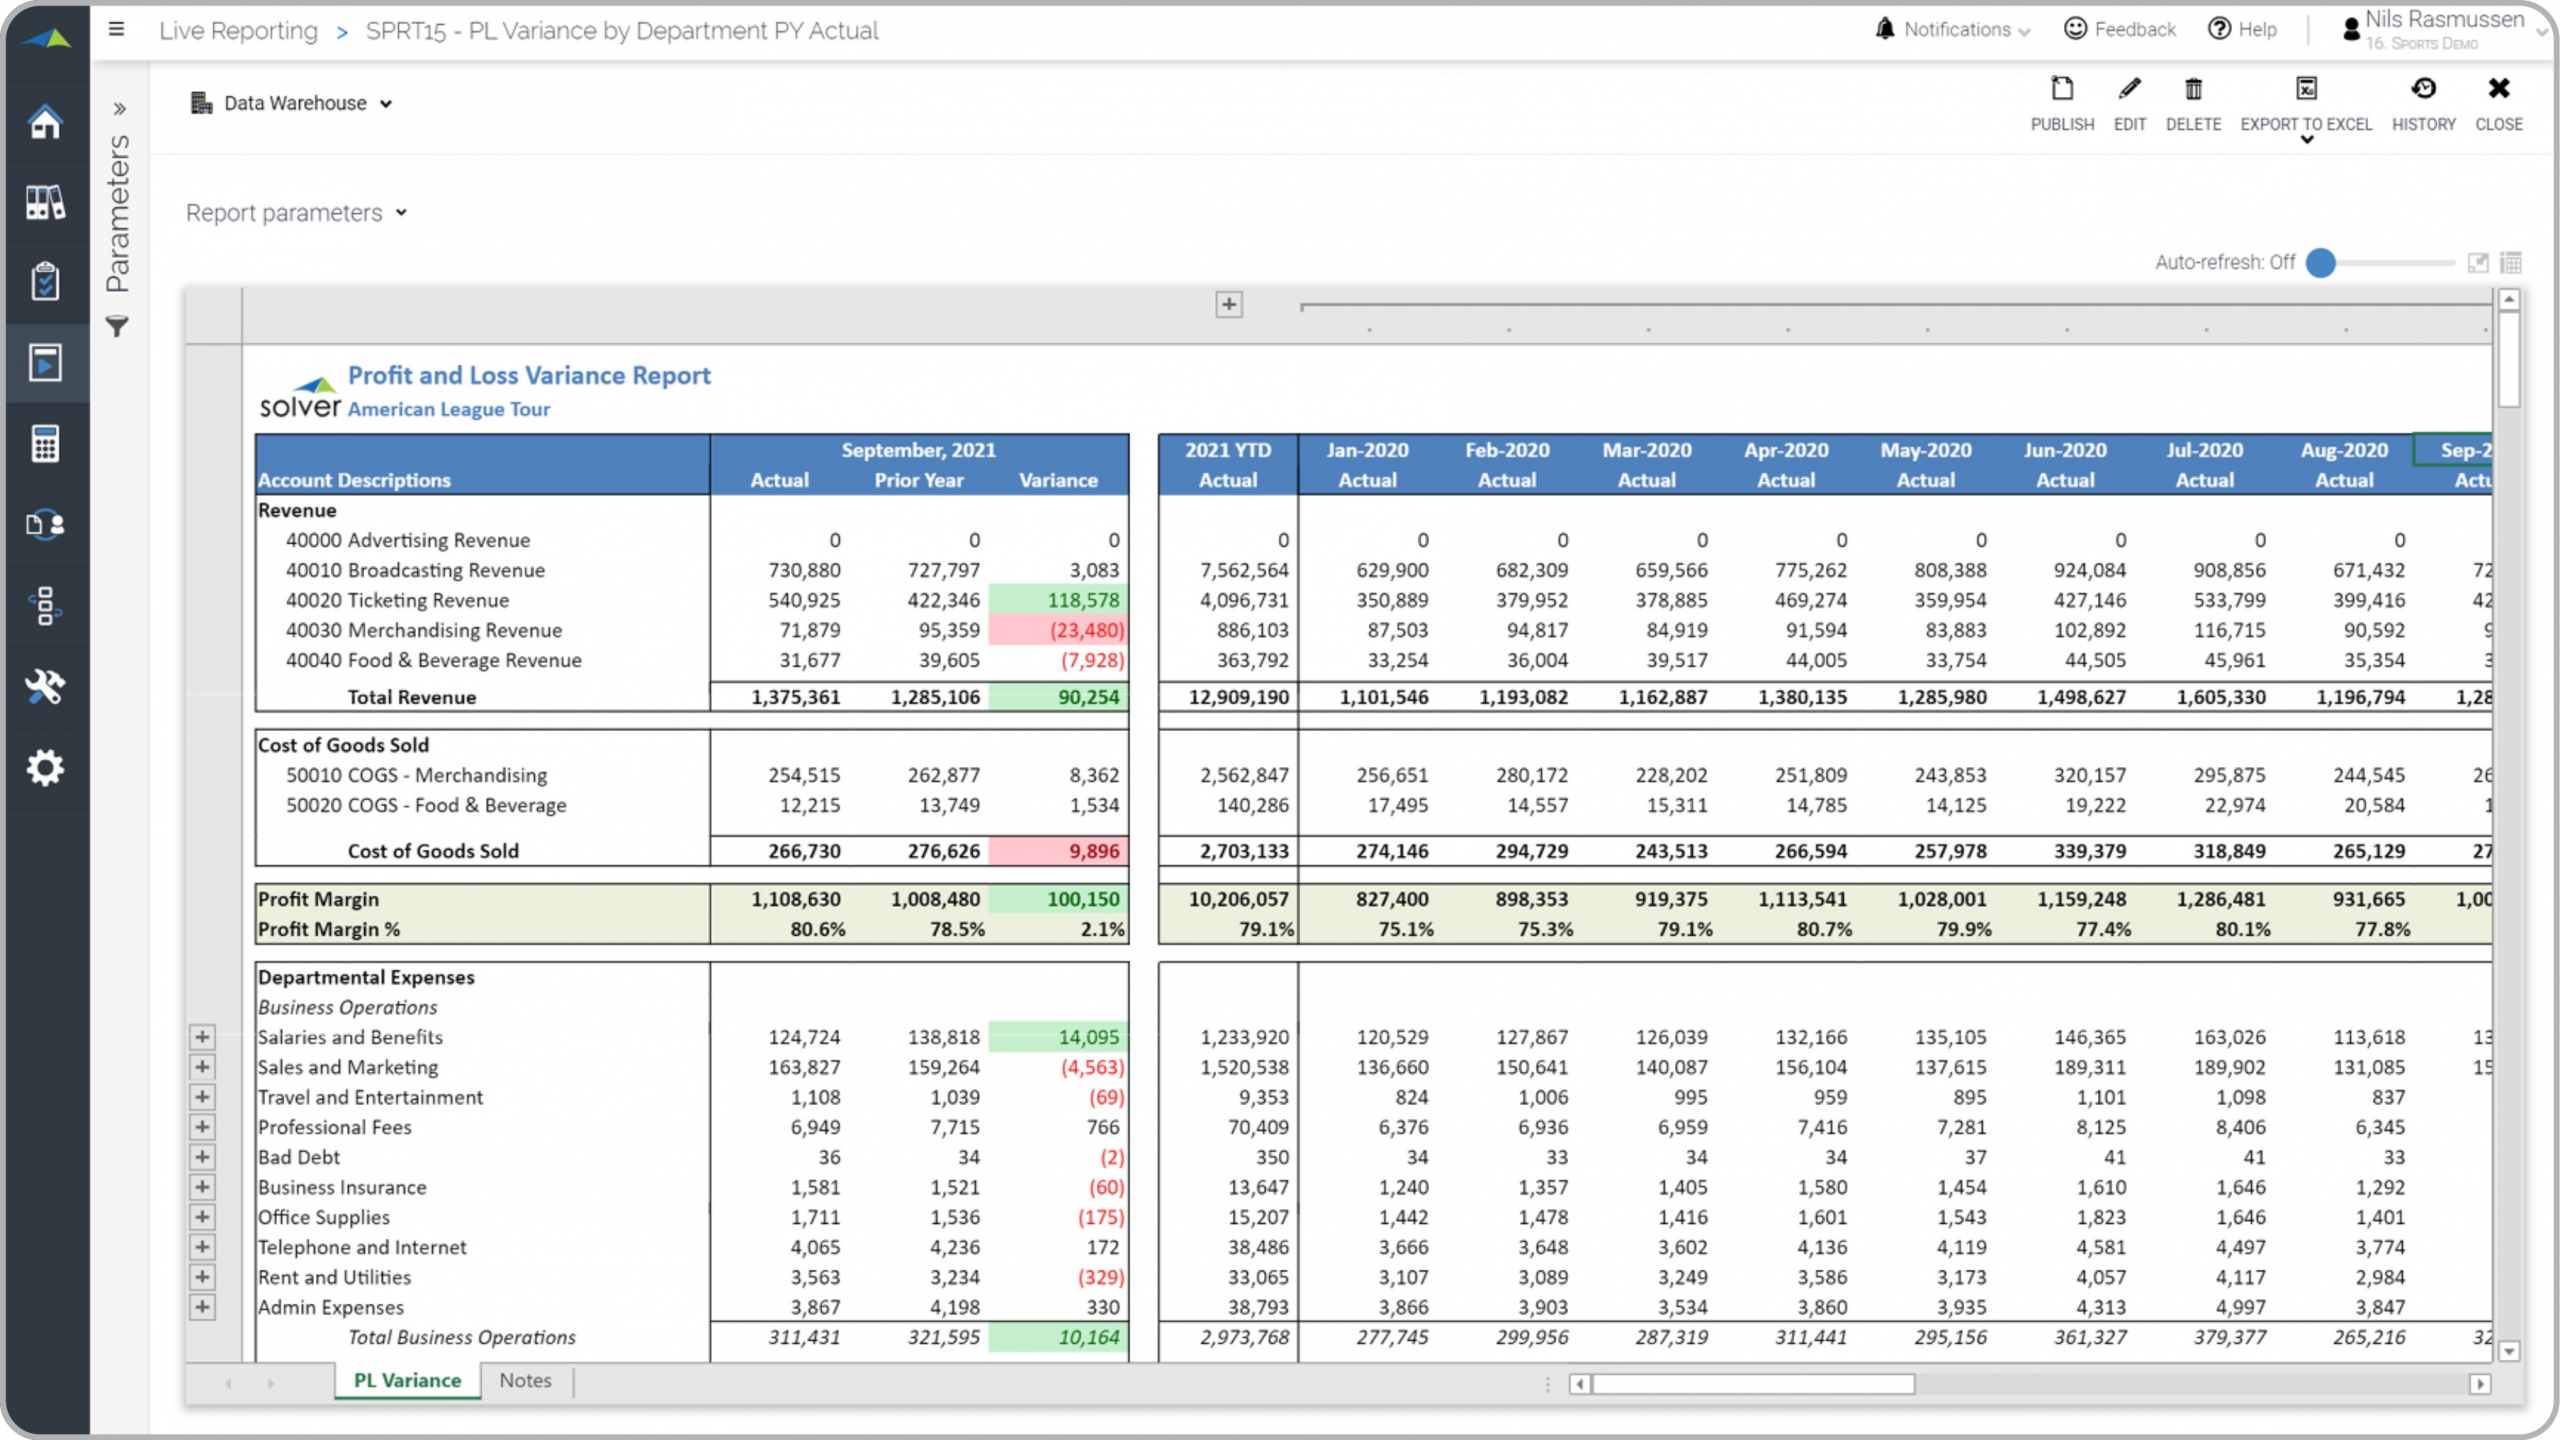 Example of a Profit & Loss Variance Report for Professional Sports Teams[/caption] You can find hundreds of additional examples
here
Who Uses This Type of
Report
? The typical users of this type of report are: financial executives, board members, management teams.
Other Reports Often Used in Conjunction with
P&L Variance Reports Progressive Executive and Financial Planning & Analysis (FP&A) departments sometimes use several different P&L Variance Reports, along with balance sheets, cash flow statements, KPI reports, financial dashboards, annual budgets and forecasts and other management and control tools.
Where Does the Data for Analysis Originate From? The Actual (historical transactions) data typically comes from enterprise resource planning (ERP) systems like: Microsoft Dynamics 365 (D365) Finance, Microsoft Dynamics 365 Business Central (D365 BC), Microsoft Dynamics AX, Microsoft Dynamics NAV, Microsoft Dynamics GP, Microsoft Dynamics SL, Sage Intacct, Sage 100, Sage 300, Sage 500, Sage X3, SAP Business One, SAP ByDesign, Acumatica, Netsuite and others. In analyses where budgets or forecasts are used, the planning data most often originates from in-house Excel spreadsheet models or from professional corporate performance management (CPM/EPM) solutions.
What Tools are Typically used for Reporting, Planning and Dashboards? Examples of business software used with the data and ERPs mentioned above are:
Example of a Profit & Loss Variance Report for Professional Sports Teams[/caption] You can find hundreds of additional examples
here
Who Uses This Type of
Report
? The typical users of this type of report are: financial executives, board members, management teams.
Other Reports Often Used in Conjunction with
P&L Variance Reports Progressive Executive and Financial Planning & Analysis (FP&A) departments sometimes use several different P&L Variance Reports, along with balance sheets, cash flow statements, KPI reports, financial dashboards, annual budgets and forecasts and other management and control tools.
Where Does the Data for Analysis Originate From? The Actual (historical transactions) data typically comes from enterprise resource planning (ERP) systems like: Microsoft Dynamics 365 (D365) Finance, Microsoft Dynamics 365 Business Central (D365 BC), Microsoft Dynamics AX, Microsoft Dynamics NAV, Microsoft Dynamics GP, Microsoft Dynamics SL, Sage Intacct, Sage 100, Sage 300, Sage 500, Sage X3, SAP Business One, SAP ByDesign, Acumatica, Netsuite and others. In analyses where budgets or forecasts are used, the planning data most often originates from in-house Excel spreadsheet models or from professional corporate performance management (CPM/EPM) solutions.
What Tools are Typically used for Reporting, Planning and Dashboards? Examples of business software used with the data and ERPs mentioned above are:
- Native ERP report writers and query tools
- Spreadsheets (for example Microsoft Excel)
- Corporate Performance Management (CPM) tools (for example Solver)
- Dashboards (for example Microsoft Power BI and Tableau)
- View 100’s of reporting, consolidations, planning, budgeting, forecasting and dashboard examples here
- View a Sports industry white paper and other industry-specific information here
- See how reports are designed in a modern report writer using a cloud-connected Excel add-in writer
- Discover how the Solver CPM solution delivers financial and operational reporting
- Discover how the Solver CPM solution delivers planning, budgeting and forecasting
- Watch demo videos of reporting, planning and dashboards
June 25, 2021
TAGS: Reporting, Solver, NPSL, report writer, Microsoft, NBA, template, practice, Acumatica, basketball, league, MLB, Netsuite, Finance, planning, profit, GP, Business Central, excel, professional, ax, Sports, income statement, forecast, Budget, Dynamics 365, budgeting, professional sports, Cloud, Software, Tableau, SAP, NRL, example, NHL, NFL, best, Sage, BC, P&L, EPL, D365, MLS, NAV, Intacct, soccer, hockey, Variance, baseball, CPM, report, SL, Management, dynamics, football, Power BI, income