
What is
a
Profit & Loss Variance Report
? Profit & Loss (P&L) Reports are considered monthly financial reporting tools and are used by CFOs and Executives to get a clear picture of profitability and variances. Some of the main functionality in this type of report is that it is parameter driven and combines a classic P&L layout with charts that highlight the KPIs in the report. The top of the report shows graphics with actual versus budget comparisons for Revenues, Profit, Profit Margin and Revenue per Employee. The columns on the left side of the report display Actual, Actual Last Year, Budget and Variances for the current month. The columns on the right side include: Year-to-date (YTD) actuals, YTD actuals for the prior year and variance. The traffic lights in the variance columns drives attention to major variances. You find an example of this type of report below.
Purpose of
Profit & Loss Variance Reports Pharmaceutical companies use Profit & Loss Variance Reports to provide leaders with a modern and easy-to-read format that makes it easy to capture key elements of the financial statement. When used as part of good business practices in finance and accounting departments, a company can improve its profitability with smarter and quicker revenue and cost decisions, and it can reduce the chances that managers miss important details in financial metrics.
Example of a
Profit & Loss Variance Report Here is an example of a Profit & Loss Report with charts, traffic light indicators and a modern layout. [caption id="" align="alignnone" width="2560"]
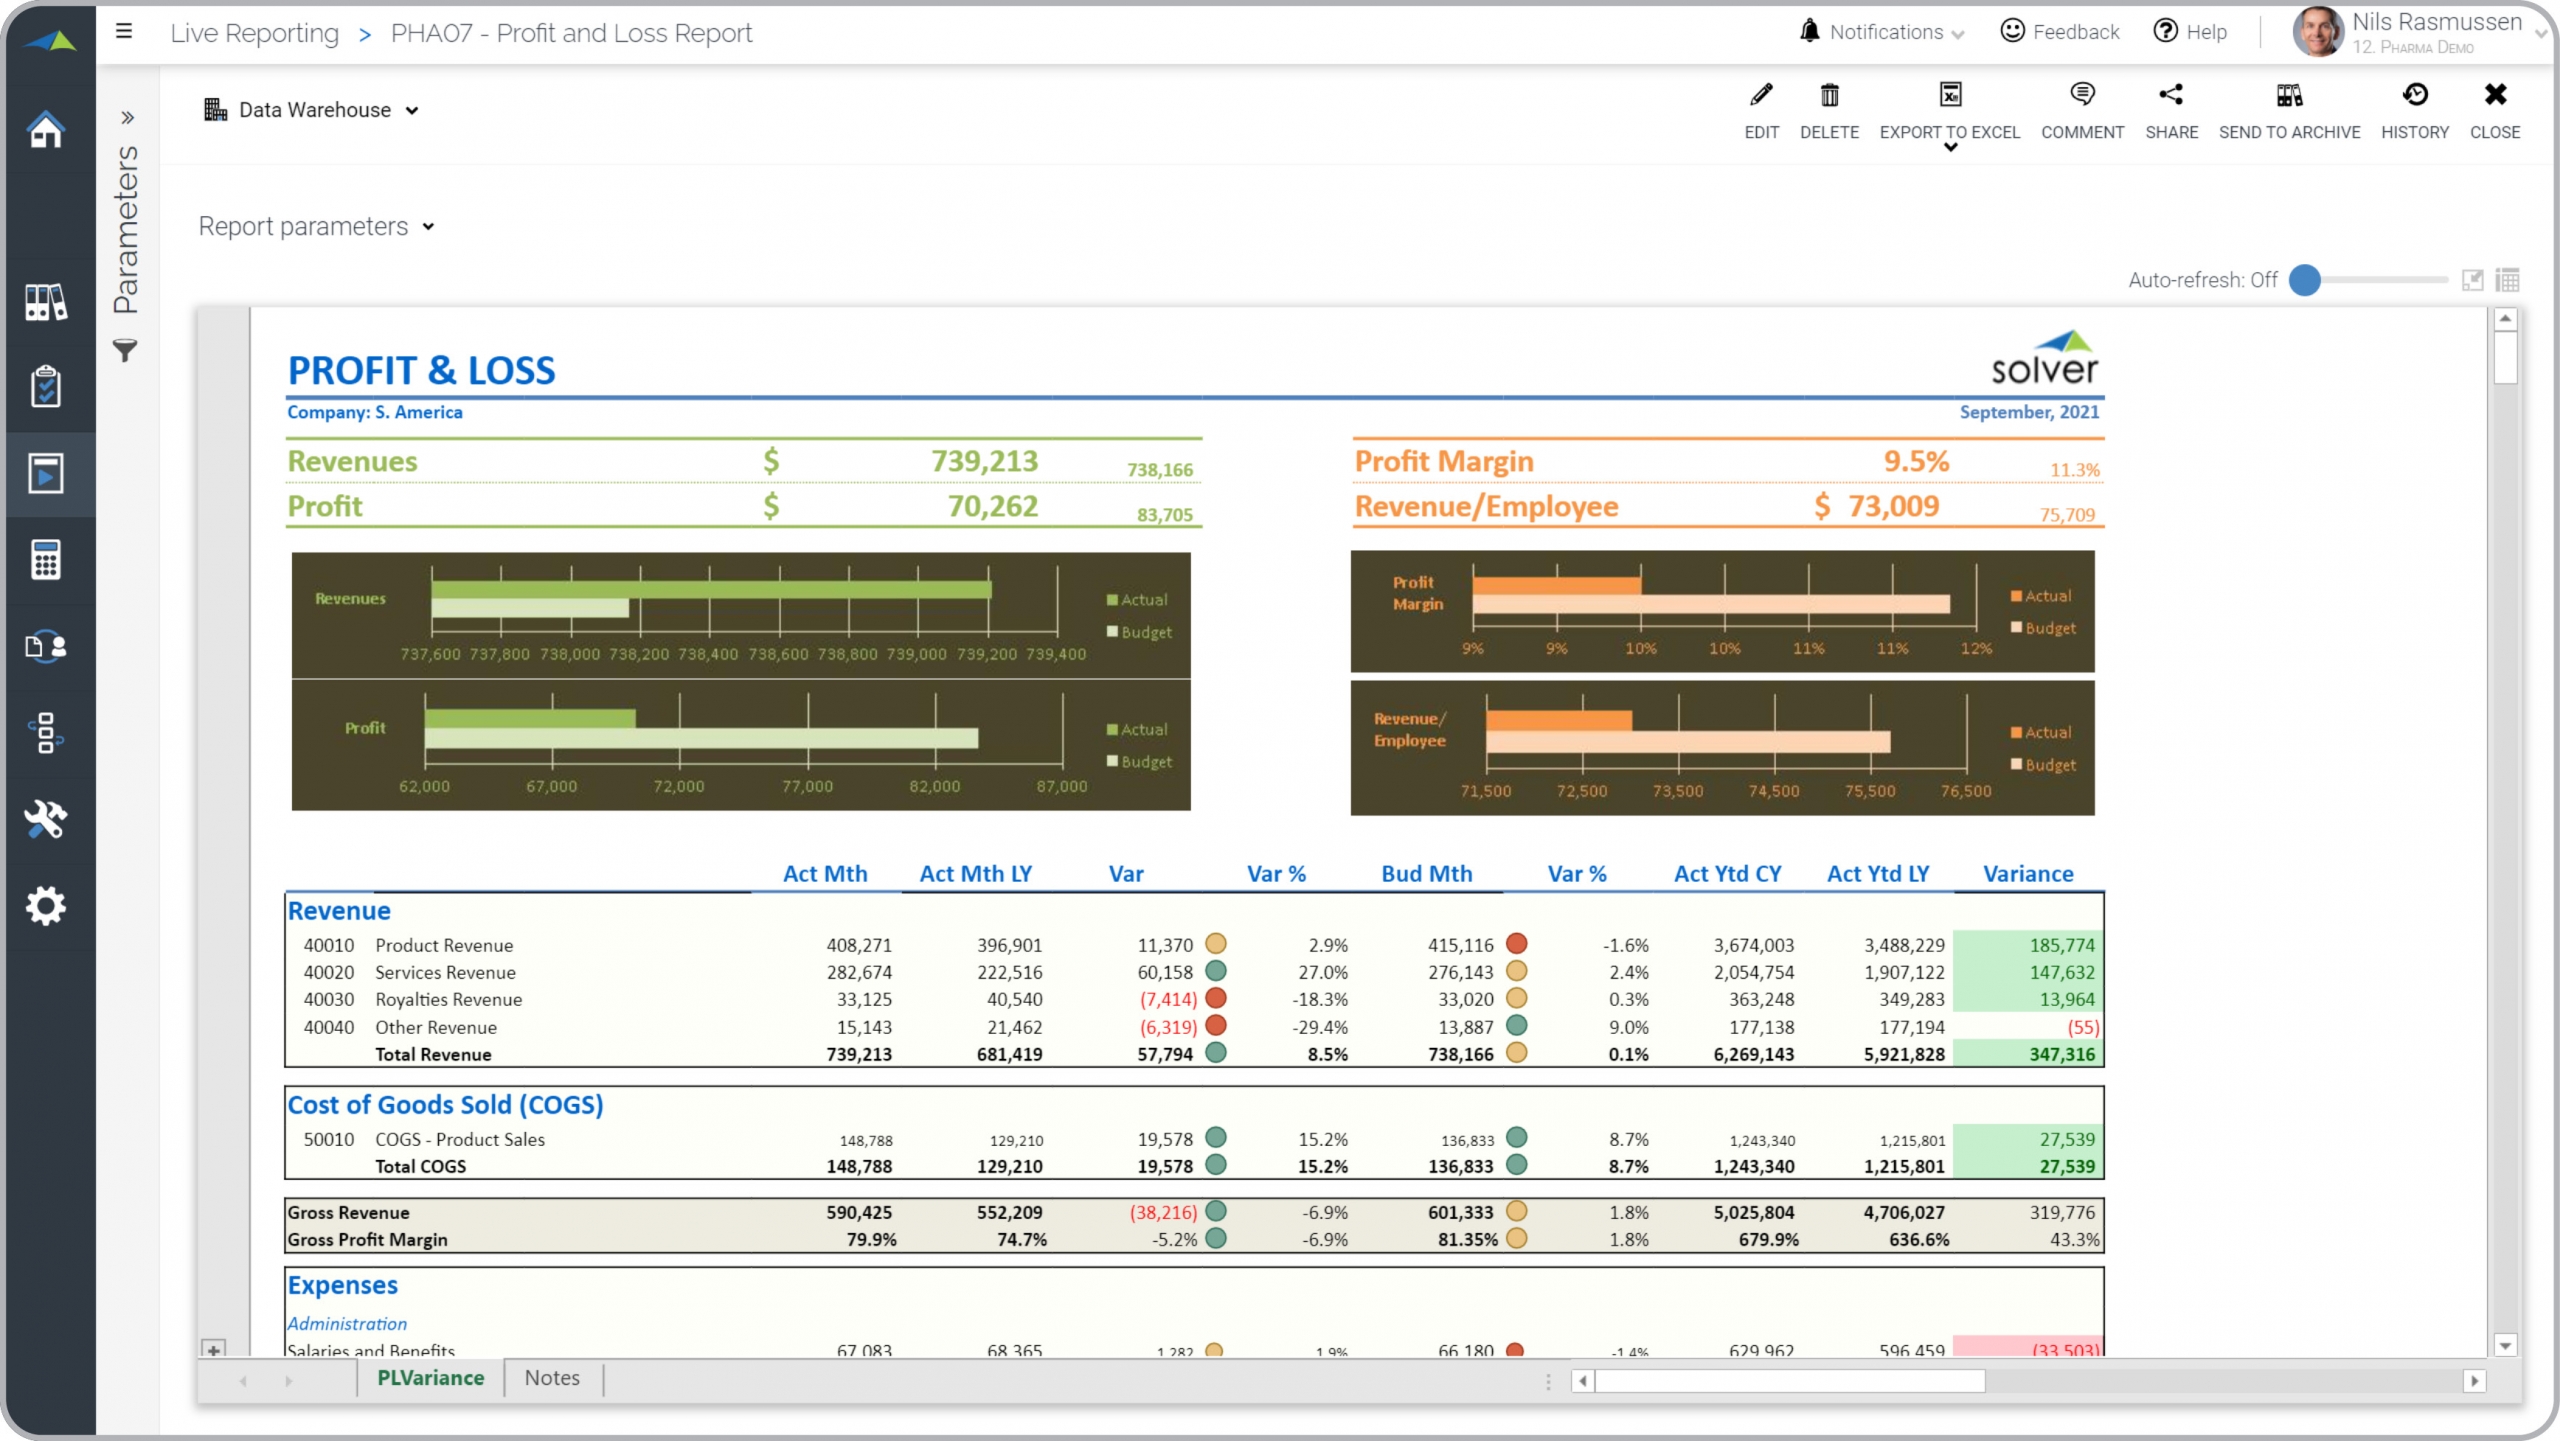 Example of a Profit & Loss Variance Report for Pharmaceutical Companies[/caption] You can find hundreds of additional examples
here
Who Uses This Type of
Report
? The typical users of this type of report are: CEOs, COOs, CFO's, board members, financial analysts.
Other Reports Often Used in Conjunction with
Profit & Loss Variance Reports Progressive FP&A departments sometimes use several different Profit & Loss Variance Reports, along with balance sheets, cash flow statements, financial dashboards, budget models and other management and control tools.
Where Does the Data for Analysis Originate From? The Actual (historical transactions) data typically comes from enterprise resource planning (ERP) systems like: Microsoft Dynamics 365 (D365) Finance, Microsoft Dynamics 365 Business Central (D365 BC), Microsoft Dynamics AX, Microsoft Dynamics NAV, Microsoft Dynamics GP, Microsoft Dynamics SL, Sage Intacct, Sage 100, Sage 300, Sage 500, Sage X3, SAP Business One, SAP ByDesign, Acumatica, Netsuite and others. In analyses where budgets or forecasts are used, the planning data most often originates from in-house Excel spreadsheet models or from professional corporate performance management (CPM/EPM) solutions.
What Tools are Typically used for Reporting, Planning and Dashboards? Examples of business software used with the data and ERPs mentioned above are:
Example of a Profit & Loss Variance Report for Pharmaceutical Companies[/caption] You can find hundreds of additional examples
here
Who Uses This Type of
Report
? The typical users of this type of report are: CEOs, COOs, CFO's, board members, financial analysts.
Other Reports Often Used in Conjunction with
Profit & Loss Variance Reports Progressive FP&A departments sometimes use several different Profit & Loss Variance Reports, along with balance sheets, cash flow statements, financial dashboards, budget models and other management and control tools.
Where Does the Data for Analysis Originate From? The Actual (historical transactions) data typically comes from enterprise resource planning (ERP) systems like: Microsoft Dynamics 365 (D365) Finance, Microsoft Dynamics 365 Business Central (D365 BC), Microsoft Dynamics AX, Microsoft Dynamics NAV, Microsoft Dynamics GP, Microsoft Dynamics SL, Sage Intacct, Sage 100, Sage 300, Sage 500, Sage X3, SAP Business One, SAP ByDesign, Acumatica, Netsuite and others. In analyses where budgets or forecasts are used, the planning data most often originates from in-house Excel spreadsheet models or from professional corporate performance management (CPM/EPM) solutions.
What Tools are Typically used for Reporting, Planning and Dashboards? Examples of business software used with the data and ERPs mentioned above are:
- Native ERP report writers and query tools
- Spreadsheets (for example Microsoft Excel)
- Corporate Performance Management (CPM) tools (for example Solver)
- Dashboards (for example Microsoft Power BI and Tableau)
- View 100’s of reporting, consolidations, planning, budgeting, forecasting and dashboard examples here
- View a Pharma Industry white paper and other industry-specific information here
- See how reports are designed in a modern report writer using a cloud-connected Excel add-in writer
- Discover how the Solver CPM solution delivers financial and operational reporting
- Discover how the Solver CPM solution delivers planning, budgeting and forecasting
- Watch demo videos of reporting, planning and dashboards
July 31, 2021
TAGS: Reporting, Solver, report writer, Microsoft, template, practice, Acumatica, financial statement, Netsuite, Finance, planning, GP, pharmaceutical, profit & loss, Business Central, excel, ax, income statement, forecast, Budget, Dynamics 365, budgeting, Cloud, Software, Tableau, SAP, example, best, Sage, BC, P&L, D365, NAV, Intacct, pharma, project, CPM, report, SL, Management, dynamics, Power BI, drug