
What is
a
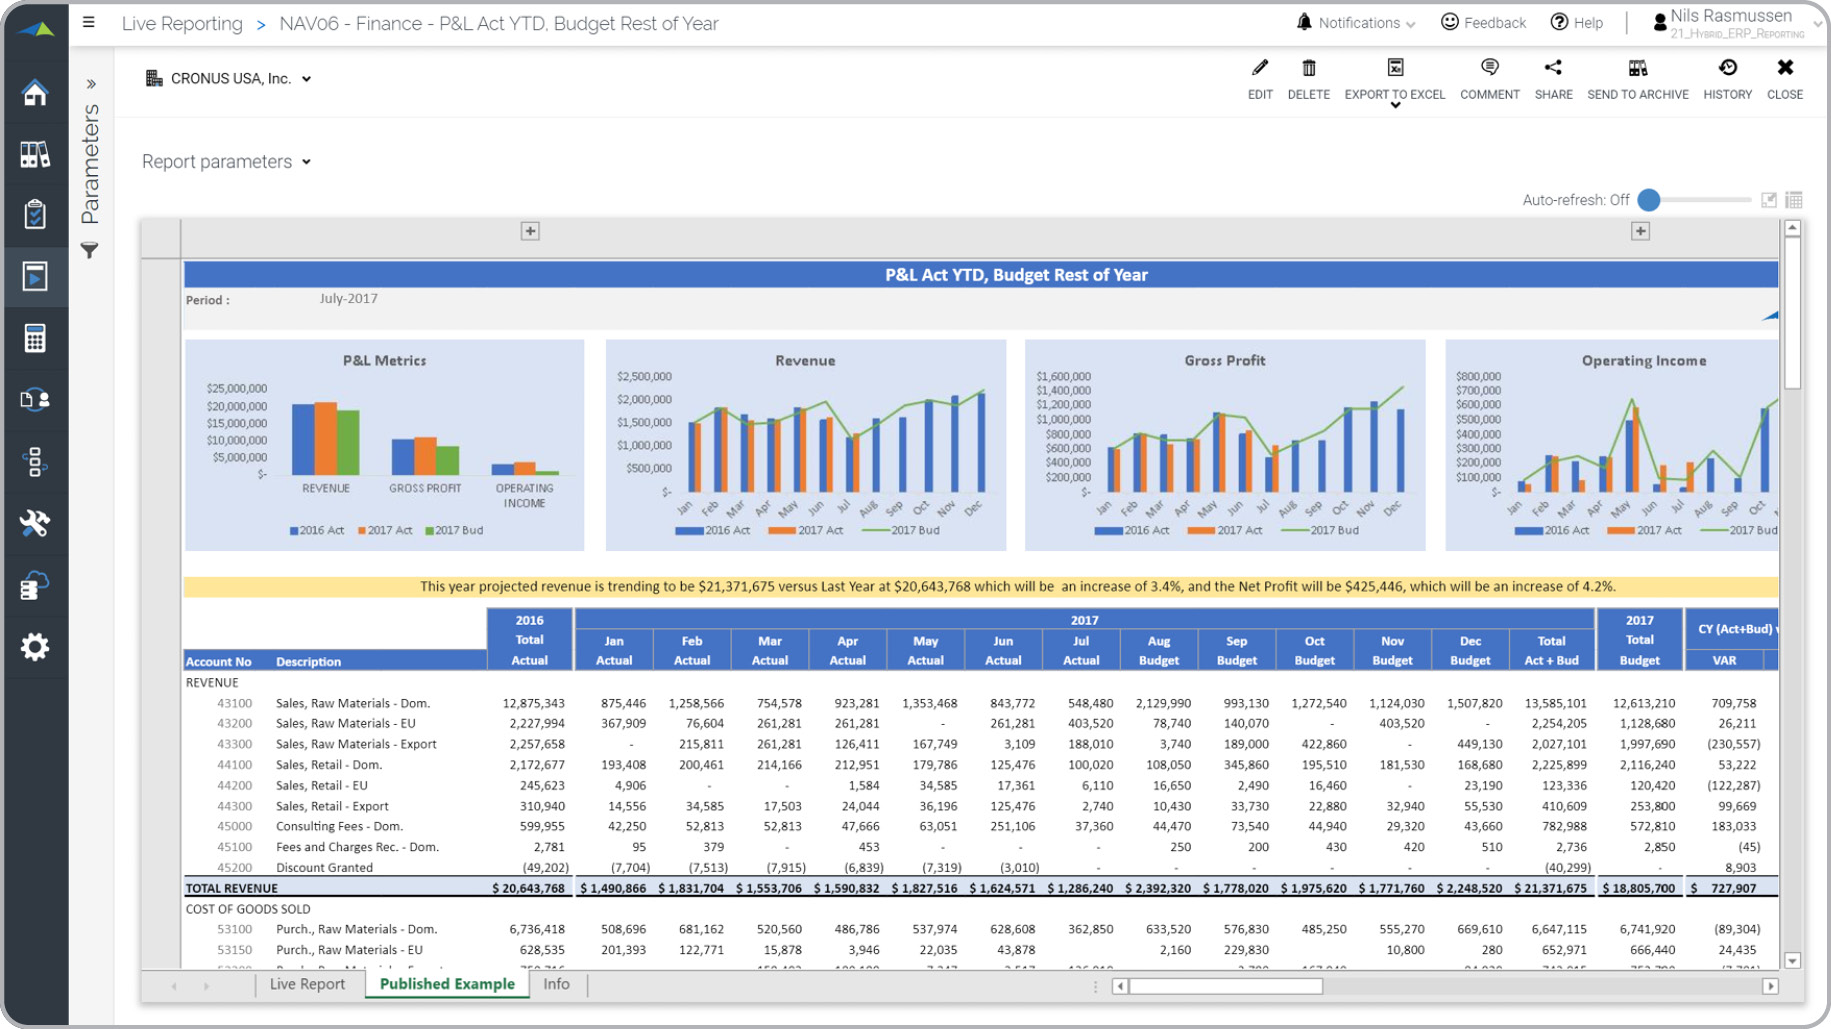
Profit & Loss Report with Automated Full Year Estimate
? Profit & Loss (P&L) estimate reports are considered important decision-making tools and are often used by CFOs and analysts to, on a monthly basis, get an automatic forecast for the full year. Some of the key functionality in this type of monthly estimate report is that it provides all-in-one analysis with graphics, narrative and a trended P&L report. The top of the report shows trend charts for Revenue, Gross Profit and Operating Income. Each chart contains data series for actual and budget for the current year and actual last year. The main section of the report displays actual for each month up to the current period and then dynamically pulls in budgets for the rest of the year to give a full year estimate. You find an example of this type of monthly estimate report below.
Purpose of
Profit & Loss Estimate Reports Companies and organizations use Profit & Loss Estimate Reports to get a continuous outlook for the full year. When used as part of good business practices in a Financial Planning & Analysis (FP&A) department, a company can improve its decision-making as well as reduce the chances that managers only look in the rear view mirror or analyze variances based in old, stale budgets.
Profit & Loss Estimate Report
Example Here is an example of a Profit & Loss Report with charts and automated full year estimate. [caption id="" align="alignnone" width="1831"]
 Profit & Loss Report Example with Automated Full Year Estimate[/caption] You can find hundreds of additional examples
here
Who Uses This Type of
Monthly estimate report
? The typical users of this type of monthly estimate report are: CFOs, Analysts and Executives.
Other
Monthly estimate report
s Often Used in Conjunction with
Profit & Loss Estimate Reports Progressive Financial Planning & Analysis (FP&A) Departments sometimes use several different Profit & Loss Estimate Reports, along with monthly variance reports, KPI dashboards, trended balance sheets and cash flow statements and other management and control tools.
Where Does the Data for Analysis Originate From? The Actual (historical transactions) data typically comes from enterprise resource planning (ERP) systems like: Microsoft Dynamics 365 (D365) Finance, Microsoft Dynamics 365 Business Central (D365 BC), Microsoft Dynamics AX, Microsoft Dynamics NAV, Microsoft Dynamics GP, Microsoft Dynamics SL, Sage Intacct, Sage 100, Sage 300, Sage 500, Sage X3, SAP Business One, SAP ByDesign, Acumatica, Netsuite and others. In analyses where budgets or forecasts are used, the planning data most often originates from in-house Excel spreadsheet models or from professional corporate performance management (CPM/EPM) solutions.
What Tools are Typically used for Reporting, Planning and Dashboards? Examples of business software used with the data and ERPs mentioned above are:
Profit & Loss Report Example with Automated Full Year Estimate[/caption] You can find hundreds of additional examples
here
Who Uses This Type of
Monthly estimate report
? The typical users of this type of monthly estimate report are: CFOs, Analysts and Executives.
Other
Monthly estimate report
s Often Used in Conjunction with
Profit & Loss Estimate Reports Progressive Financial Planning & Analysis (FP&A) Departments sometimes use several different Profit & Loss Estimate Reports, along with monthly variance reports, KPI dashboards, trended balance sheets and cash flow statements and other management and control tools.
Where Does the Data for Analysis Originate From? The Actual (historical transactions) data typically comes from enterprise resource planning (ERP) systems like: Microsoft Dynamics 365 (D365) Finance, Microsoft Dynamics 365 Business Central (D365 BC), Microsoft Dynamics AX, Microsoft Dynamics NAV, Microsoft Dynamics GP, Microsoft Dynamics SL, Sage Intacct, Sage 100, Sage 300, Sage 500, Sage X3, SAP Business One, SAP ByDesign, Acumatica, Netsuite and others. In analyses where budgets or forecasts are used, the planning data most often originates from in-house Excel spreadsheet models or from professional corporate performance management (CPM/EPM) solutions.
What Tools are Typically used for Reporting, Planning and Dashboards? Examples of business software used with the data and ERPs mentioned above are:
- Native ERP report writers and query tools
- Spreadsheets (for example Microsoft Excel)
- Corporate Performance Management (CPM) tools (for example Solver)
- Dashboards (for example Microsoft Power BI and Tableau)
- View 100’s of reporting, consolidations, planning, budgeting, forecasting and dashboard examples here
- See how reports are designed in a modern report writer using a cloud-connected Excel add-in writer
- Discover how the Solver CPM solution delivers financial and operational reporting
- Discover how the Solver CPM solution delivers planning, budgeting and forecasting
- Watch demo videos of reporting, planning and dashboards
November 11, 2020
TAGS: Reporting, Solver, report writer, Microsoft, template, practice, Acumatica, Netsuite, Finance, GP, profit & loss, Business Central, excel, ax, income statement, forecast, Budget, forecasting, estimate, budgeting, Cloud, Software, Tableau, SAP, example, best, Sage, BC, P&L, D365, NAV, Intacct, CPM, report, SL, Management, dynamics, Power BI