
What is
a
Patient Assistance Dashboard
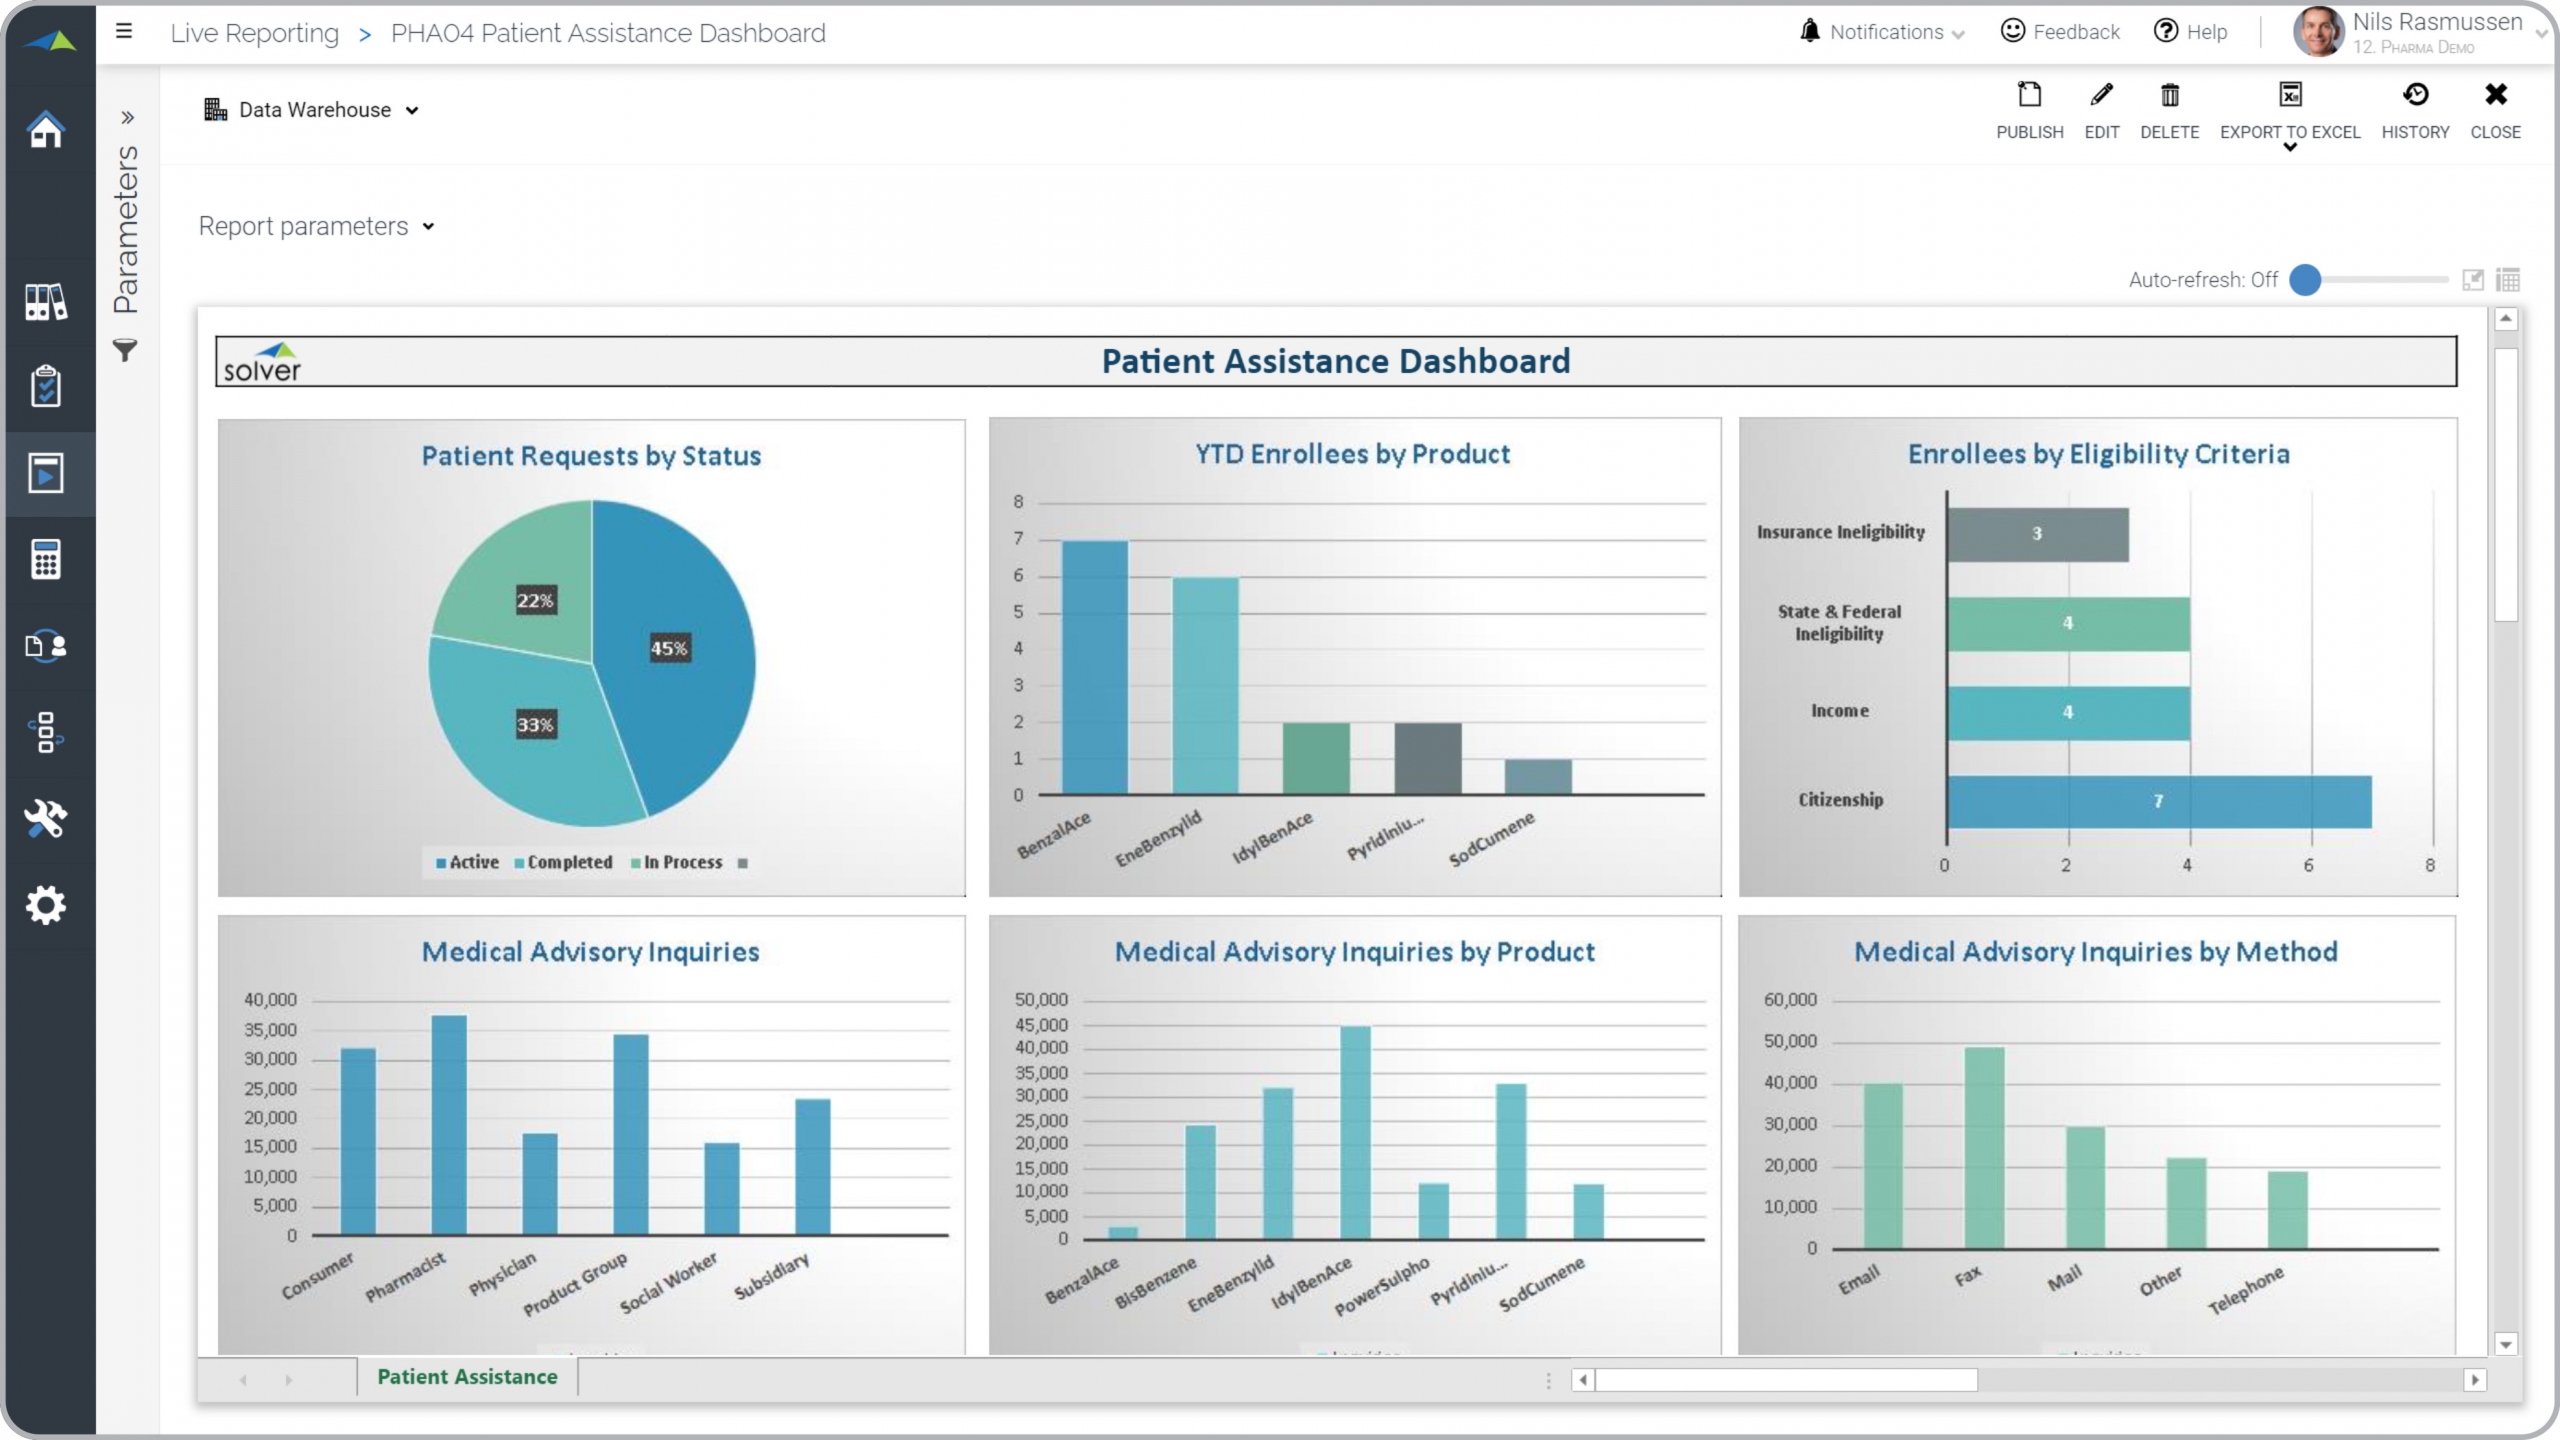
? Patient Assistance Dashboards are considered program analysis tools and are used by managers of patient initiatives and researchers to monitor performance and results of patient assistance programs. Some of the main functionality in this type of report is that it provides analysis from eight different perspectives, including: 1) Patient requests by status, 2) Medical advisory inquiries, 3) YTD enrollees by product, 4) Medical advisory inquiries by product, 5) Enrollees by eligibility criteria, and 6) Medical advisory inquiries by method. You find an example of this type of report below.
Purpose of
Patient Advisory Dashboards Pharmaceutical companies use Patient Advisory Dashboards to give managers a good understanding of results of active patient programs. When used as part of best practices in Product and Patient Program Departments, a company can improve its initiatives and service level, and it can reduce the chances that managers lack good field data when making their decisions.
Example of a
Patient Advisory Dashboard Here is an example of a Patient Assistance Dashboard with inquiries and enrollment metrics. [caption id="" align="alignnone" width="2560"]
 Example of a Patient Assistance Dashboard for Pharmaceutical Companies[/caption] You can find hundreds of additional examples
here
Who Uses This Type of
Report
? The typical users of this type of report are: customer service leaders, researchers, product managers.
Other Reports Often Used in Conjunction with
Patient Advisory Dashboards Progressive Product and Patient Program departments sometimes use several different Patient Advisory Dashboards, along with detailed patient program reports, KPI dashboards and other management and control tools.
Where Does the Data for Analysis Originate From? The Actual (historical transactions) data typically comes from enterprise resource planning (ERP) systems like: Microsoft Dynamics 365 (D365) Finance, Microsoft Dynamics 365 Business Central (D365 BC), Microsoft Dynamics AX, Microsoft Dynamics NAV, Microsoft Dynamics GP, Microsoft Dynamics SL, Sage Intacct, Sage 100, Sage 300, Sage 500, Sage X3, SAP Business One, SAP ByDesign, Acumatica, Netsuite and others. In analyses where budgets or forecasts are used, the planning data most often originates from in-house Excel spreadsheet models or from professional corporate performance management (CPM/EPM) solutions.
What Tools are Typically used for Reporting, Planning and Dashboards? Examples of business software used with the data and ERPs mentioned above are:
Example of a Patient Assistance Dashboard for Pharmaceutical Companies[/caption] You can find hundreds of additional examples
here
Who Uses This Type of
Report
? The typical users of this type of report are: customer service leaders, researchers, product managers.
Other Reports Often Used in Conjunction with
Patient Advisory Dashboards Progressive Product and Patient Program departments sometimes use several different Patient Advisory Dashboards, along with detailed patient program reports, KPI dashboards and other management and control tools.
Where Does the Data for Analysis Originate From? The Actual (historical transactions) data typically comes from enterprise resource planning (ERP) systems like: Microsoft Dynamics 365 (D365) Finance, Microsoft Dynamics 365 Business Central (D365 BC), Microsoft Dynamics AX, Microsoft Dynamics NAV, Microsoft Dynamics GP, Microsoft Dynamics SL, Sage Intacct, Sage 100, Sage 300, Sage 500, Sage X3, SAP Business One, SAP ByDesign, Acumatica, Netsuite and others. In analyses where budgets or forecasts are used, the planning data most often originates from in-house Excel spreadsheet models or from professional corporate performance management (CPM/EPM) solutions.
What Tools are Typically used for Reporting, Planning and Dashboards? Examples of business software used with the data and ERPs mentioned above are:
- Native ERP report writers and query tools
- Spreadsheets (for example Microsoft Excel)
- Corporate Performance Management (CPM) tools (for example Solver)
- Dashboards (for example Microsoft Power BI and Tableau)
- View 100’s of reporting, consolidations, planning, budgeting, forecasting and dashboard examples here
- View a Pharma Industry white paper and other industry-specific information here
- See how reports are designed in a modern report writer using a cloud-connected Excel add-in writer
- Discover how the Solver CPM solution delivers financial and operational reporting
- Discover how the Solver CPM solution delivers planning, budgeting and forecasting
- Watch demo videos of reporting, planning and dashboards
July 29, 2021
TAGS: Reporting, Solver, report writer, Microsoft, template, practice, Acumatica, request, Netsuite, Finance, planning, GP, dashboard, status, pharmaceutical, Business Central, excel, ax, forecast, Budget, Dynamics 365, budgeting, KPI, Cloud, Software, Tableau, SAP, example, best, Sage, BC, D365, NAV, Intacct, pharma, project, CPM, report, SL, Management, dynamics, Power BI, patient, medical advisory inquiry, enrollee, participant, eligibility, patient assistance, drug