
What is
an
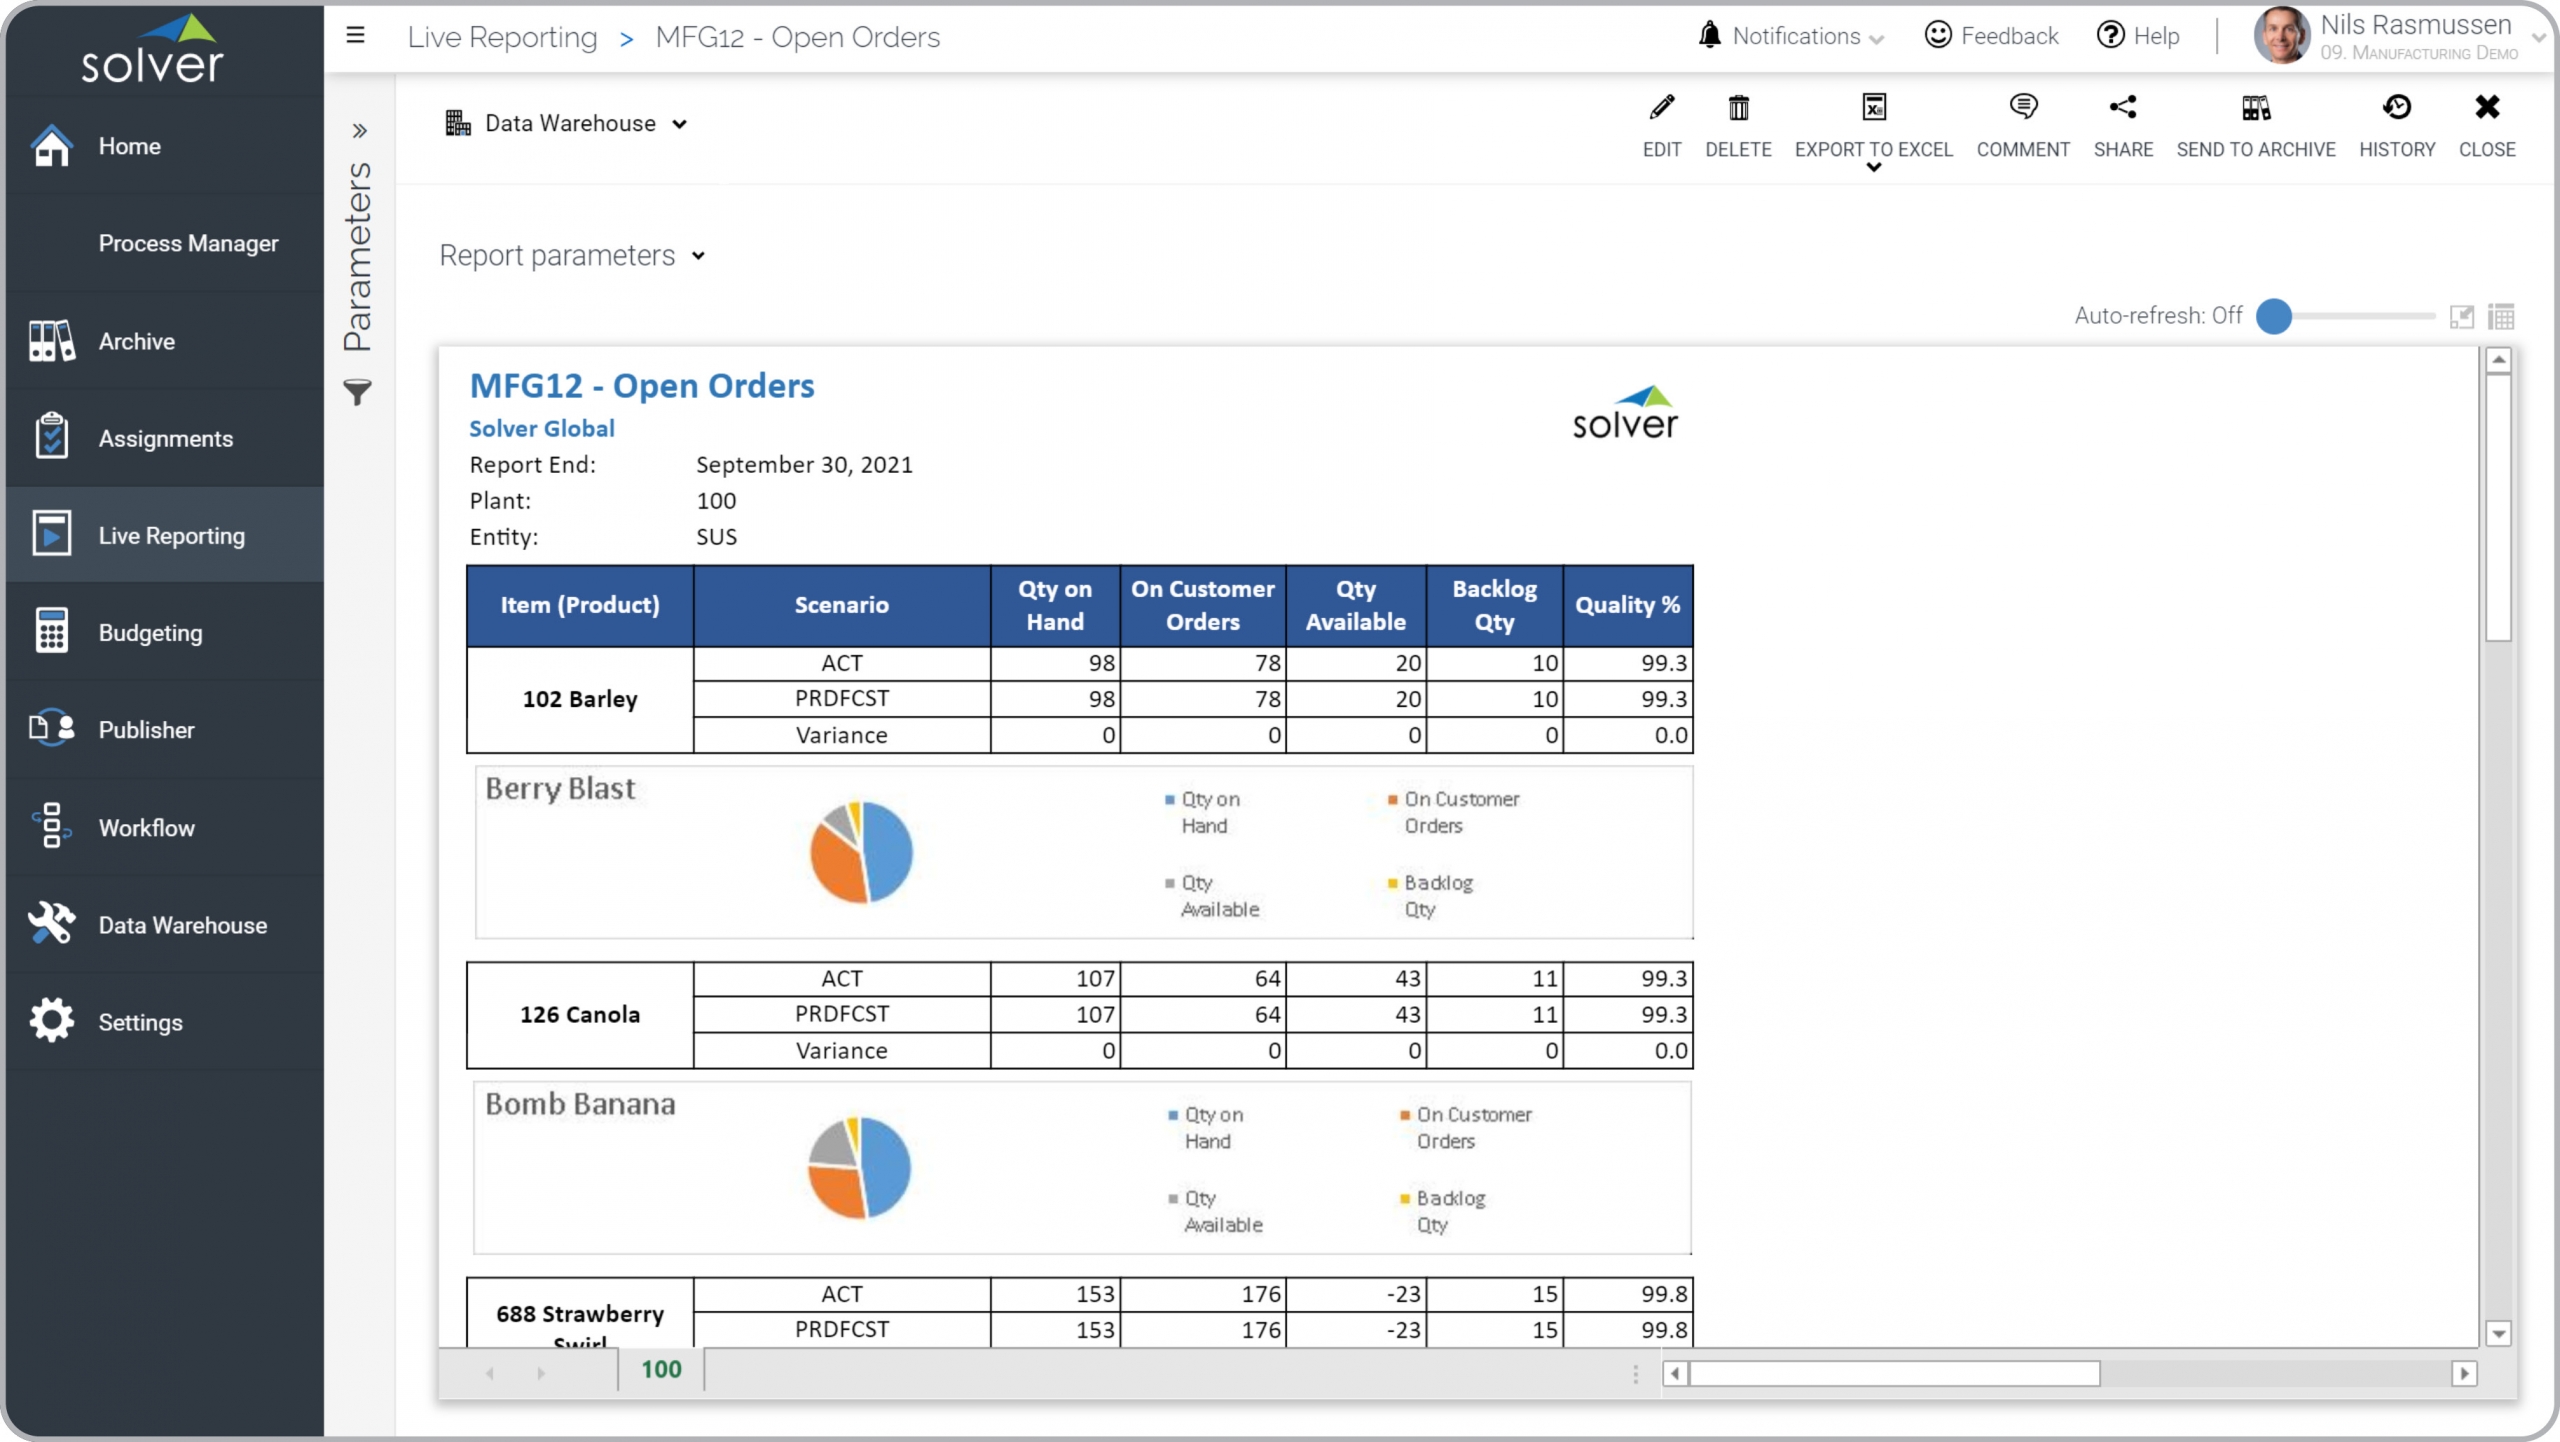
Open Orders by Item Report for Manufacturing Plants
? Open Orders Reports are considered operational reports and are often used by production and plant managers to determine the plant's ability to fulfill customer orders. Key functionality in this type of report shows actual, production forecast and variance down the rows and key order metrics across the columns. Each report section covers one item (product). Metrics include quantity on hand, customer orders, quantity available, backlog quantity, and quality. You will find an example of this type of report below.
Purpose of
Open Order Reports Manufacturing plants use Open Order Reports to quickly gauge the plant's ability to satisfy customer demand, as well as, plan production and delivery times based on backlog. When used as part of good business practices in a Production department, a company can improve its manufacturing forecast and inventory planning, as well as, reduce the chances that major backlogs impact customer satisfaction issues and sub-optimal revenues.
Open Order Report
Example Here is an example of a modern Open Orders report by Item. [caption id="" align="alignnone" width="2560"]
 Open Orders by Item Report for Manufacturing Plants Example[/caption] You can find hundreds of additional examples
here.
Who Uses This Type of
Report
? The typical users of this type of report are: COOs, plant and production managers.
Other
Report
s Often Used in Conjunction with
Open Order Reports Progressive Production Departments sometimes use several different Open Order Reports, along with production dashboards, inventory reports, sales forecast, sales reports and other management and control tools.
Where Does the Data for Analysis Originate From? The Actual (historical transactions) data typically comes from enterprise resource planning (ERP) systems like: Microsoft Dynamics 365 (D365) Finance, Microsoft Dynamics 365 Business Central (D365 BC), Microsoft Dynamics AX, Microsoft Dynamics NAV, Microsoft Dynamics GP, Microsoft Dynamics SL, Sage Intacct, Sage 100, Sage 300, Sage 500, Sage X3, SAP Business One, SAP ByDesign, Acumatica, Netsuite and others. In analyses where budgets or forecasts are used, the planning data most often originates from in-house Excel spreadsheet models or from professional corporate performance management (CPM/EPM) solutions.
What Tools are Typically used for Reporting, Planning and Dashboards? Examples of business software used with the data and ERPs mentioned above are:
Open Orders by Item Report for Manufacturing Plants Example[/caption] You can find hundreds of additional examples
here.
Who Uses This Type of
Report
? The typical users of this type of report are: COOs, plant and production managers.
Other
Report
s Often Used in Conjunction with
Open Order Reports Progressive Production Departments sometimes use several different Open Order Reports, along with production dashboards, inventory reports, sales forecast, sales reports and other management and control tools.
Where Does the Data for Analysis Originate From? The Actual (historical transactions) data typically comes from enterprise resource planning (ERP) systems like: Microsoft Dynamics 365 (D365) Finance, Microsoft Dynamics 365 Business Central (D365 BC), Microsoft Dynamics AX, Microsoft Dynamics NAV, Microsoft Dynamics GP, Microsoft Dynamics SL, Sage Intacct, Sage 100, Sage 300, Sage 500, Sage X3, SAP Business One, SAP ByDesign, Acumatica, Netsuite and others. In analyses where budgets or forecasts are used, the planning data most often originates from in-house Excel spreadsheet models or from professional corporate performance management (CPM/EPM) solutions.
What Tools are Typically used for Reporting, Planning and Dashboards? Examples of business software used with the data and ERPs mentioned above are:
- Native ERP report writers and query tools
- Spreadsheets (for example Microsoft Excel)
- Corporate Performance Management (CPM) tools (for example Solver)
- Dashboards (for example Microsoft Power BI and Tableau)
- View 100’s of reporting, consolidations, planning, budgeting, forecasting and dashboard examples here
- Manufacturing White Paper and other industry-specific information here
- See how reports are designed in a modern report writer using a cloud-connected Excel add-in writer
- Discover how the Solver CPM solution delivers financial and operational reporting
- Discover how the Solver CPM solution delivers planning, budgeting and forecasting
- Watch demo videos of reporting, planning and dashboards
September 24, 2020
TAGS: Reporting, Solver, plant, report writer, Microsoft, consolidation, manufacturing, template, practice, Acumatica, Netsuite, Finance, GP, Inventory, Business Central, excel, item, ax, forecast, Budget, forecasting, budgeting, Cloud, Software, production, product, Tableau, SAP, example, best, Sage, BC, D365, NAV, Intacct, open orders, facility, Variance, backlog, CPM, report, SL, Management, dynamics, Power BI