
What is
a
Income Statement Report for Bank Branches
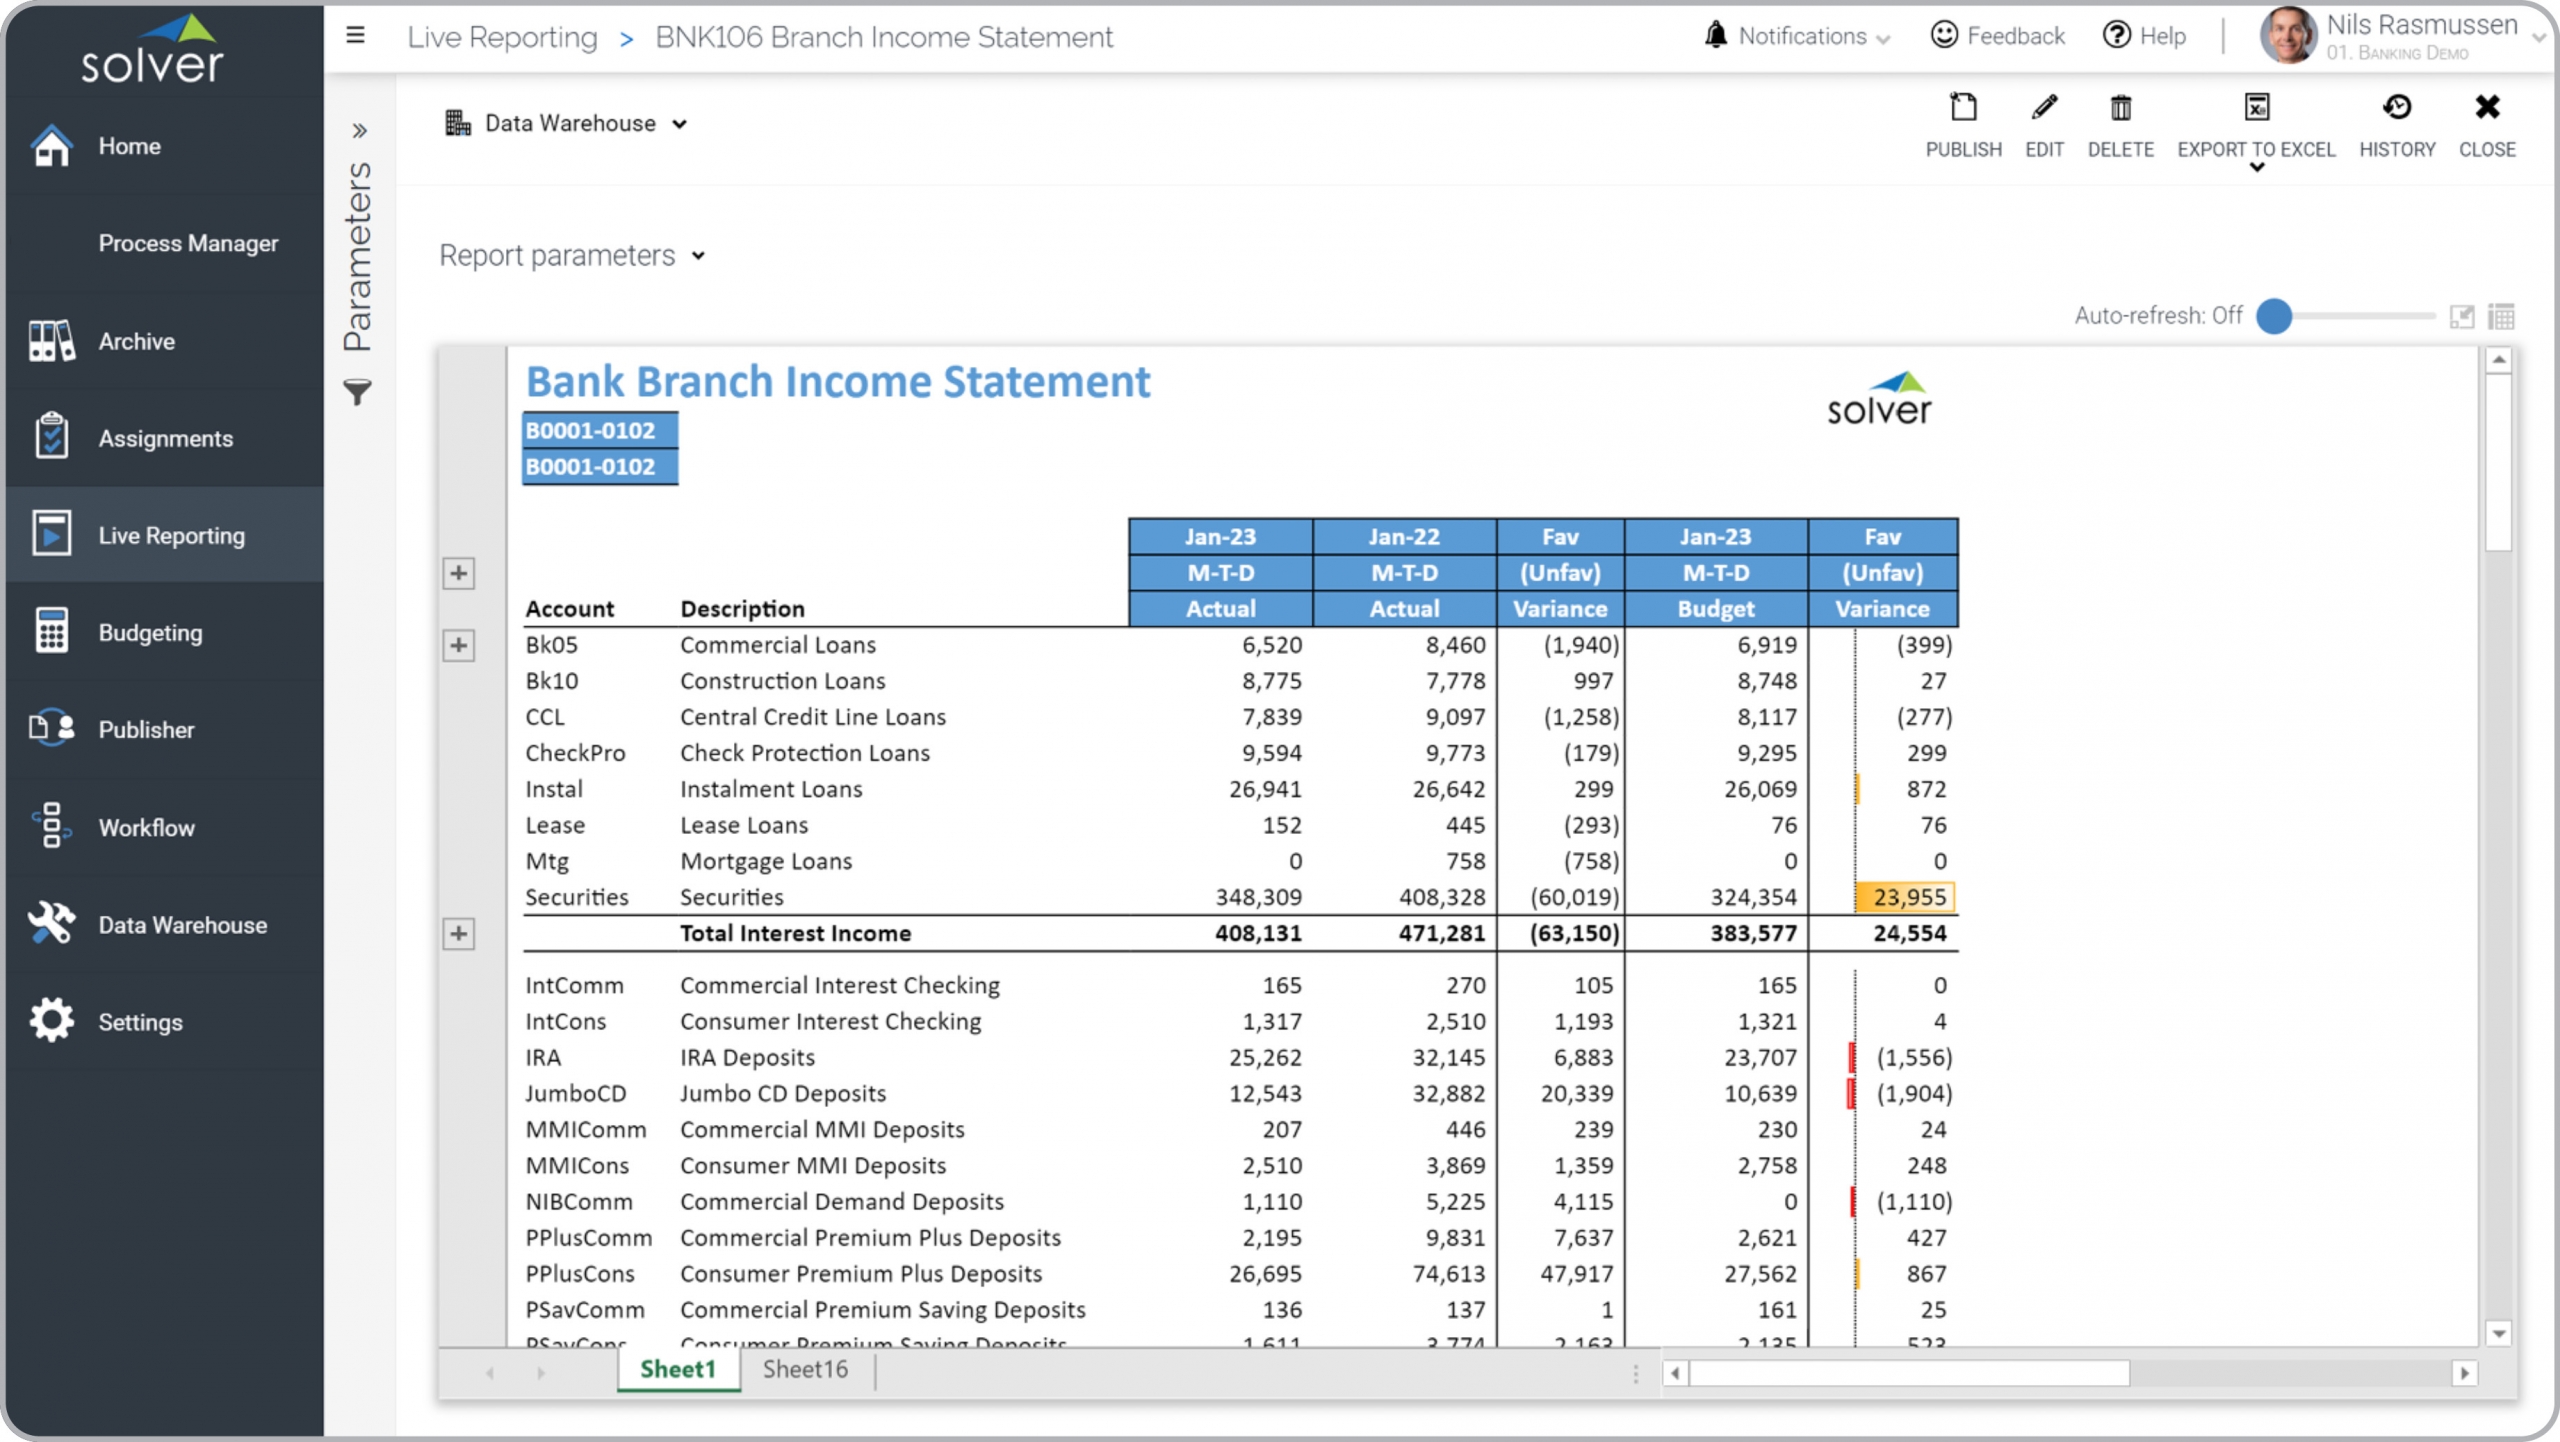
? Branch-level Income Statements are considered essential month-end reports and are used by corporate executives and branch managers to track revenues, expenses and profitability. Some of the main functionality in this type of report is that it enables the user to run them for any month and any bank branch, including at the consolidated level. The columns compare the current month to the same period last year as well as to the budget, and it calculates the variances. You find an example of this type of report below.
Purpose of
Branch-level Income Statements Banks use Branch-level Income Statements to enable self-service analysis of the monthly performance of each branch, including monitoring of variances from plan and prior year. When used as part of good business practices in Financial Planning & Analysis (FP&A) departments, a bank can improve its strategic decisions and profitability, and it can reduce the chances that managers don't quickly discover major variances and the reasons behind them.
Example of a
Branch-level Income Statement Here is an example of a Branch-level Income Statement Report with prior year and budget variances. [caption id="" align="alignnone" width="2560"]
 Example of an Income Statement Report for bank branches[/caption] You can find hundreds of additional examples
here
Who Uses This Type of
Report
? The typical users of this type of report are: Executives, branch managers, finance leader.
Other Reports Often Used in Conjunction with
Branch-level Income Statements Progressive Financial Planning & Analysis (FP&A) departments sometimes use several different Branch-level Income Statements, along with consolidated income statements, balance sheets, cash flow statements, KPI reports, executive dashboards, budget models and forecasts and other management and control tools.
Where Does the Data for Analysis Originate From? The Actual (historical transactions) data typically comes from enterprise resource planning (ERP) systems like: Microsoft Dynamics 365 (D365) Finance, Microsoft Dynamics 365 Business Central (D365 BC), Microsoft Dynamics AX, Microsoft Dynamics NAV, Microsoft Dynamics GP, Microsoft Dynamics SL, Sage Intacct, Sage 100, Sage 300, Sage 500, Sage X3, SAP Business One, SAP ByDesign, Acumatica, Netsuite and others. In analyses where budgets or forecasts are used, the planning data most often originates from in-house Excel spreadsheet models or from professional corporate performance management (CPM/EPM) solutions.
What Tools are Typically used for Reporting, Planning and Dashboards? Examples of business software used with the data and ERPs mentioned above are:
Example of an Income Statement Report for bank branches[/caption] You can find hundreds of additional examples
here
Who Uses This Type of
Report
? The typical users of this type of report are: Executives, branch managers, finance leader.
Other Reports Often Used in Conjunction with
Branch-level Income Statements Progressive Financial Planning & Analysis (FP&A) departments sometimes use several different Branch-level Income Statements, along with consolidated income statements, balance sheets, cash flow statements, KPI reports, executive dashboards, budget models and forecasts and other management and control tools.
Where Does the Data for Analysis Originate From? The Actual (historical transactions) data typically comes from enterprise resource planning (ERP) systems like: Microsoft Dynamics 365 (D365) Finance, Microsoft Dynamics 365 Business Central (D365 BC), Microsoft Dynamics AX, Microsoft Dynamics NAV, Microsoft Dynamics GP, Microsoft Dynamics SL, Sage Intacct, Sage 100, Sage 300, Sage 500, Sage X3, SAP Business One, SAP ByDesign, Acumatica, Netsuite and others. In analyses where budgets or forecasts are used, the planning data most often originates from in-house Excel spreadsheet models or from professional corporate performance management (CPM/EPM) solutions.
What Tools are Typically used for Reporting, Planning and Dashboards? Examples of business software used with the data and ERPs mentioned above are:
- Native ERP report writers and query tools
- Spreadsheets (for example Microsoft Excel)
- Corporate Performance Management (CPM) tools (for example Solver)
- Dashboards (for example Microsoft Power BI and Tableau)
- View 100’s of reporting, consolidations, planning, budgeting, forecasting and dashboard examples here
- View a Bank industry white paper and other industry-specific information here
- See how reports are designed in a modern report writer using a cloud-connected Excel add-in writer
- Discover how the Solver CPM solution delivers financial and operational reporting
- Discover how the Solver CPM solution delivers planning, budgeting and forecasting
- Watch demo videos of reporting, planning and dashboards
September 10, 2021
TAGS: Reporting, Solver, report writer, Microsoft, template, practice, Acumatica, financial statement, Netsuite, Finance, planning, GP, fintech, profit & loss, Business Central, excel, ax, income statement, forecast, Budget, Dynamics 365, budgeting, bank, Cloud, Software, Tableau, SAP, example, best, Sage, BC, P&L, D365, NAV, Intacct, Variance, financial institution, CPM, report, branch, SL, Management, dynamics, Power BI