
What is
a Grants Funding Report for Public Sector and Nonprofit Organizations
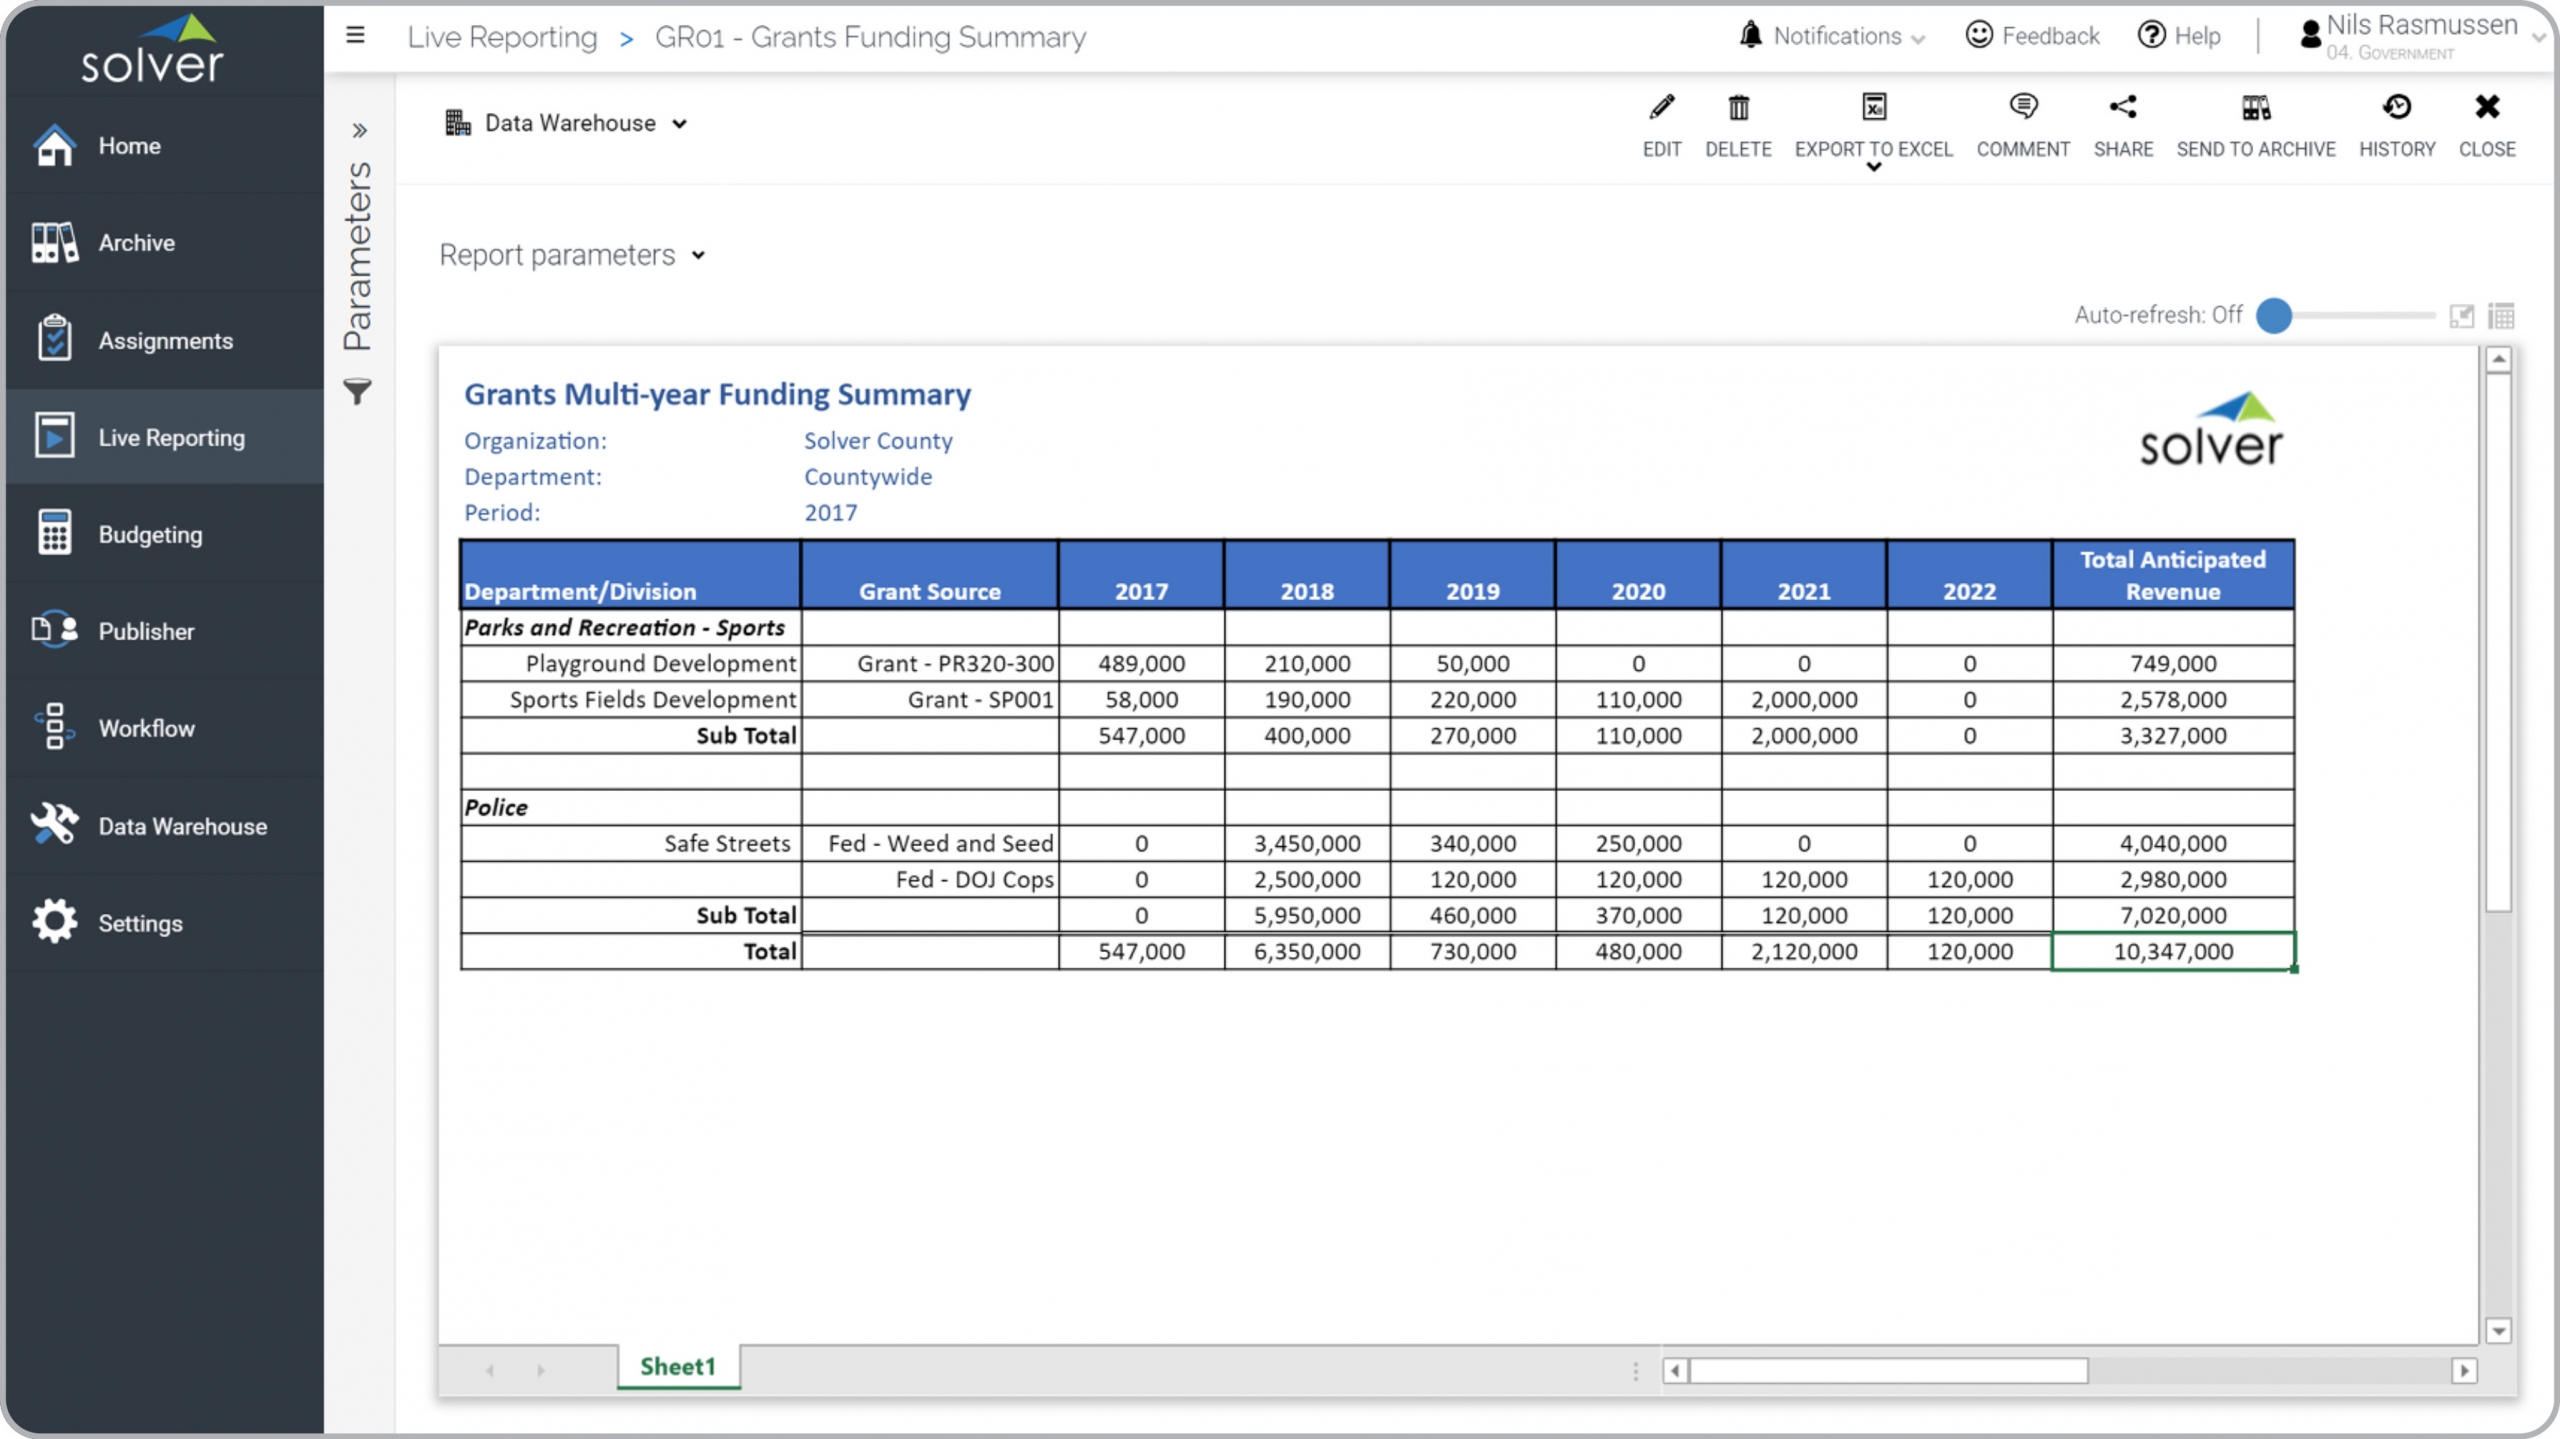
? Grant Funding Reports are considered grant analysis tools and are used by CFOs and Grant Managers to review expected funding across multiple years. Some of the main functionality in this type of report is that it is parameter driven and based on the year entered by the user it will display data for the next six years (or any user-definable range of years). The columns show Department/Division, Grant Source, Annual figures and Total Anticipated Revenue. You find an example of this type of report below.
Purpose of
Grant Funding Reports Public Sector and nonprofit organizations use Grant Funding Reports to enable clear insight into all expected revenue from grants in future years. When used as part of good business practices in Accounting and FP&A departments, an organization can improve its grant strategies and investment planning for various programs, and it can reduce the chances that funding for initiatives runs into problems due to lack of visibility into expected grant revenues.
Example of a
Grant Funding Report Here is an example of a Multi-Year Grants Funding Report with annual figures across six years. [caption id="" align="alignnone" width="2560"]
 Example of a Grants Funding Report for Public Sector and Nonprofit Organizations[/caption] You can find hundreds of additional examples
here
Who Uses This Type of
Report
? The typical users of this type of report are: CFOs, controllers, accountants, grant managers, program managers.
Other Reports Often Used in Conjunction with
Grant Funding Reports Progressive Accounting and FP&A departments sometimes use several different Grant Funding Reports, along with detailed grant reports, grant budgets, grant dashboards, financial statements, program and initiative reports and other management and control tools.
Where Does the Data for Analysis Originate From? The Actual (historical transactions) data typically comes from grant management systems and enterprise resource planning (ERP) systems like: Microsoft Dynamics 365 (D365) Finance, Microsoft Dynamics 365 Business Central (D365 BC), Microsoft Dynamics AX, Microsoft Dynamics NAV, Microsoft Dynamics GP, Microsoft Dynamics SL, Sage Intacct, Sage 100, Sage 300, Sage 500, Sage X3, SAP Business One, SAP ByDesign, Acumatica, Netsuite and others. In analyses where budgets or forecasts are used, the planning data most often originates from in-house Excel spreadsheet models or from professional corporate performance management (CPM/EPM) solutions.
What Tools are Typically used for Reporting, Planning and Dashboards? Examples of business software used with the data and ERPs mentioned above are:
Example of a Grants Funding Report for Public Sector and Nonprofit Organizations[/caption] You can find hundreds of additional examples
here
Who Uses This Type of
Report
? The typical users of this type of report are: CFOs, controllers, accountants, grant managers, program managers.
Other Reports Often Used in Conjunction with
Grant Funding Reports Progressive Accounting and FP&A departments sometimes use several different Grant Funding Reports, along with detailed grant reports, grant budgets, grant dashboards, financial statements, program and initiative reports and other management and control tools.
Where Does the Data for Analysis Originate From? The Actual (historical transactions) data typically comes from grant management systems and enterprise resource planning (ERP) systems like: Microsoft Dynamics 365 (D365) Finance, Microsoft Dynamics 365 Business Central (D365 BC), Microsoft Dynamics AX, Microsoft Dynamics NAV, Microsoft Dynamics GP, Microsoft Dynamics SL, Sage Intacct, Sage 100, Sage 300, Sage 500, Sage X3, SAP Business One, SAP ByDesign, Acumatica, Netsuite and others. In analyses where budgets or forecasts are used, the planning data most often originates from in-house Excel spreadsheet models or from professional corporate performance management (CPM/EPM) solutions.
What Tools are Typically used for Reporting, Planning and Dashboards? Examples of business software used with the data and ERPs mentioned above are:
- Native ERP report writers and query tools
- Spreadsheets (for example Microsoft Excel)
- Corporate Performance Management (CPM) tools (for example Solver)
- Dashboards (for example Microsoft Power BI and Tableau)
- View 100’s of reporting, consolidations, planning, budgeting, forecasting and dashboard examples here
- View a Public Sector white paper and other industry-specific information here
- See how reports are designed in a modern report writer using a cloud-connected Excel add-in writer
- Discover how the Solver CPM solution delivers financial and operational reporting
- Discover how the Solver CPM solution delivers planning, budgeting and forecasting
- Watch demo videos of reporting, planning and dashboards
July 10, 2021
TAGS: Reporting, Solver, local, report writer, Microsoft, template, practice, Acumatica, Netsuite, Finance, public, planning, GP, Government, grant, Business Central, state, excel, ax, forecast, Budget, Dynamics 365, budgeting, revenue, Cloud, Software, Tableau, SAP, example, best, Sage, BC, D365, NAV, Intacct, county, city, CPM, report, sector, SL, Management, dynamics, Power BI, funding, grant summary, multi-year, anticipated, grant revenue, grant funding report