
What is a
Financial Dashboard for Manufacturing Companies
? Financial dashboards are considered performance monitoring tools and are used by CFOs and Executives to analyze monthly Profit & Loss and Balance sheet metrics and trends. Some of the main functionality in this type of dashboard is that it gives the user an easy way to analyze financial results using several different perspectives, including: 1) Monthly balance sheet summary with variances versus prior periods, 2) Monthly trend in net assets, 3) Net assets compared to prior periods, 4) Actual vs budgeted employee headcount, 5) Actual vs budgeted revenue, profit, profit margin and revenue per employee, 6) Actual, budgeted and forecasted monthly trend, and 7) Profit & Loss summary with actual, budget and prior month comparisons with variances. The user can select month and year from the dropdown list on the top of the dashboard. You find an example of this type of dashboard below.
Purpose of
Financial Dashboards Manufacturing companies use Financial Dashboards to provide executives with an easy way to analyze financial performance. When used as part of good business practices in Financial Planning & Analysis (FP&A) departments, an organization can improve and speed up its decision-making, and it can reduce the chances that leaders don't frequently pay attention to financial metrics because of lack of self-service or too much detail.
Example of a
Financial Summary Dashboard Here is an example of a Financial Dashboard for a manufacturing company with key metrics from the P&L and balance sheet as well as headcount information. [caption id="" align="alignnone" width="2560"]
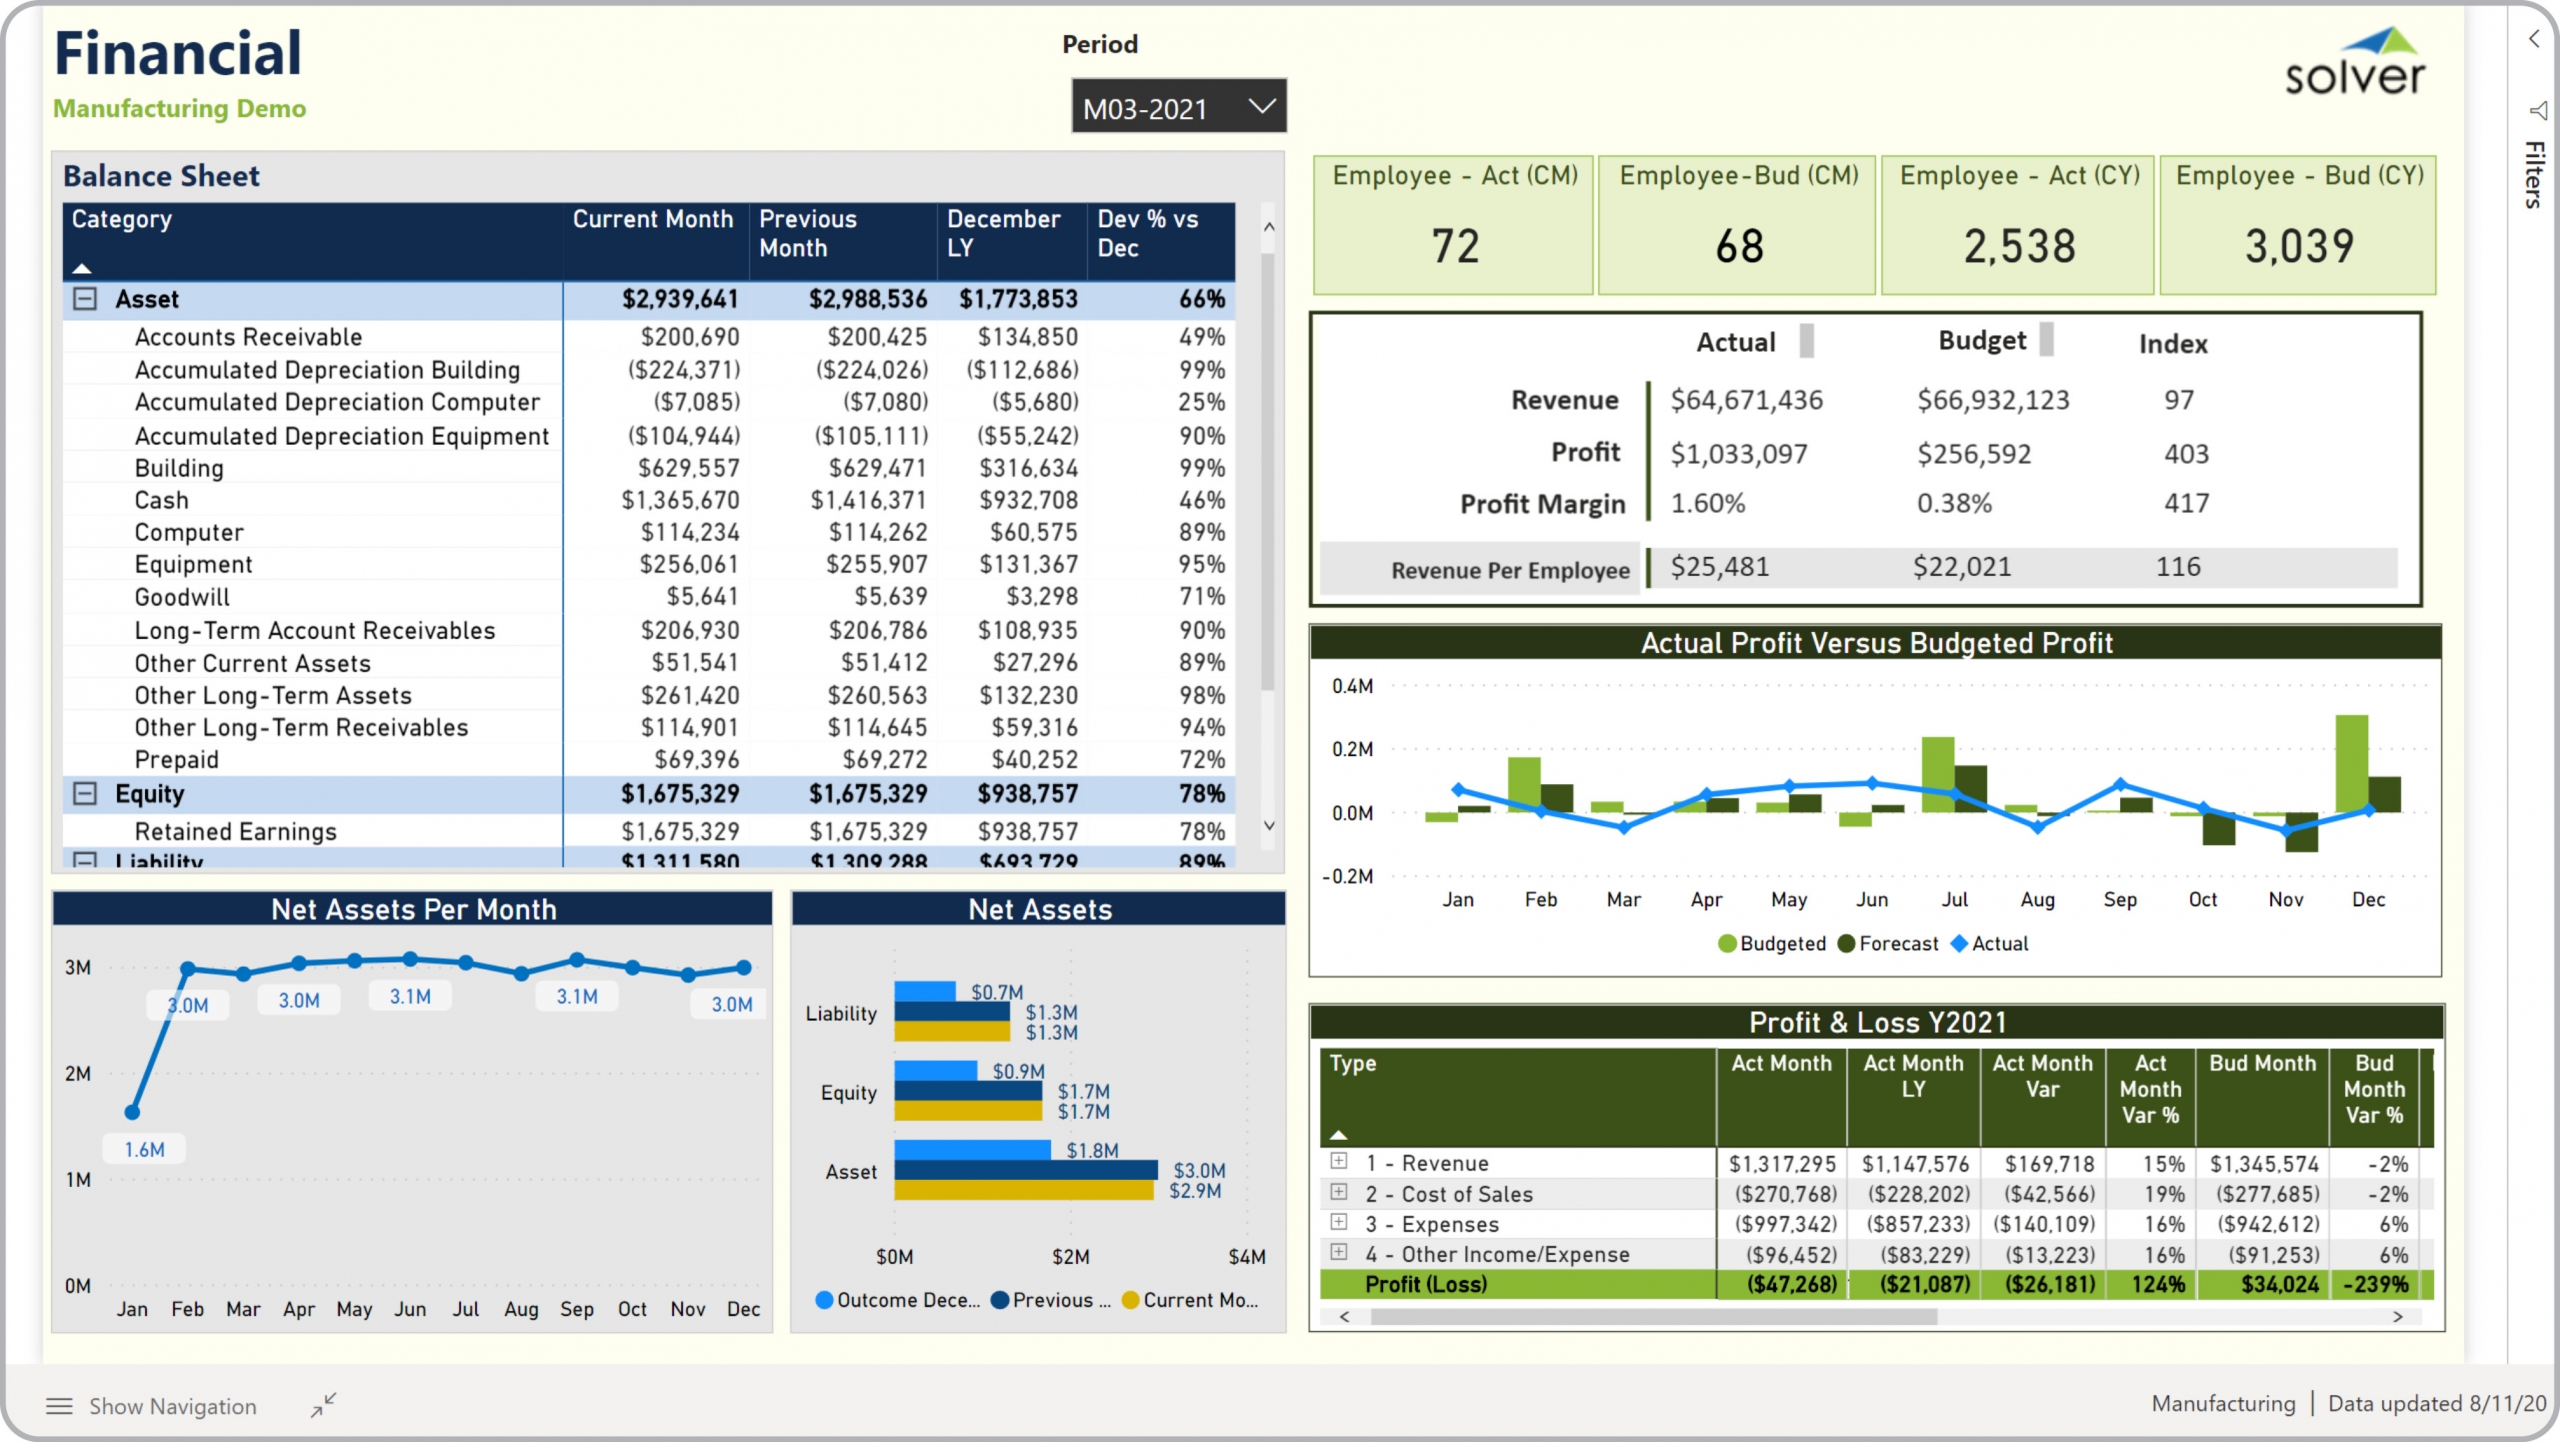 Example of a Financial Dashboard for Manufacturing Companies[/caption] You can find hundreds of additional examples
here
Who Uses This Type of
Dashboard
? The typical users of this type of dashboard are: Executives, CFOs, analysts.
Other Reports Often Used in Conjunction with
Financial Dashboards Progressive Financial Planning & Analysis (FP&A) departments sometimes use several different Financial Dashboards, along with detailed versions of profit & loss reports, balance sheets, cash flow statements, revenue dashboards and other management and control tools.
Where Does the Data for Analysis Originate From? The Actual (historical transactions) data typically comes from enterprise resource planning (ERP) systems like: Microsoft Dynamics 365 (D365) Finance, Microsoft Dynamics 365 Business Central (D365 BC), Microsoft Dynamics AX, Microsoft Dynamics NAV, Microsoft Dynamics GP, Microsoft Dynamics SL, Sage Intacct, Sage 100, Sage 300, Sage 500, Sage X3, SAP Business One, SAP ByDesign, Acumatica, Netsuite and others. In analyses where budgets or forecasts are used, the planning data most often originates from in-house Excel spreadsheet models or from professional corporate performance management (CPM/EPM) solutions.
What Tools are Typically used for Reporting, Planning and Dashboards? Examples of business software used with the data and ERPs mentioned above are:
Example of a Financial Dashboard for Manufacturing Companies[/caption] You can find hundreds of additional examples
here
Who Uses This Type of
Dashboard
? The typical users of this type of dashboard are: Executives, CFOs, analysts.
Other Reports Often Used in Conjunction with
Financial Dashboards Progressive Financial Planning & Analysis (FP&A) departments sometimes use several different Financial Dashboards, along with detailed versions of profit & loss reports, balance sheets, cash flow statements, revenue dashboards and other management and control tools.
Where Does the Data for Analysis Originate From? The Actual (historical transactions) data typically comes from enterprise resource planning (ERP) systems like: Microsoft Dynamics 365 (D365) Finance, Microsoft Dynamics 365 Business Central (D365 BC), Microsoft Dynamics AX, Microsoft Dynamics NAV, Microsoft Dynamics GP, Microsoft Dynamics SL, Sage Intacct, Sage 100, Sage 300, Sage 500, Sage X3, SAP Business One, SAP ByDesign, Acumatica, Netsuite and others. In analyses where budgets or forecasts are used, the planning data most often originates from in-house Excel spreadsheet models or from professional corporate performance management (CPM/EPM) solutions.
What Tools are Typically used for Reporting, Planning and Dashboards? Examples of business software used with the data and ERPs mentioned above are:
- Native ERP report writers and query tools
- Spreadsheets (for example Microsoft Excel)
- Corporate Performance Management (CPM) tools (for example Solver)
- Dashboards (for example Microsoft Power BI and Tableau)
- View 100’s of reporting, consolidations, planning, budgeting, forecasting and dashboard examples here
- View a Manufacturing white paper and other industry-specific information here
- See how reports are designed in a modern report writer using a cloud-connected Excel add-in writer
- Discover how the Solver CPM solution delivers financial and operational reporting
- Discover how the Solver CPM solution delivers planning, budgeting and forecasting
- Watch demo videos of reporting, planning and dashboards
March 28, 2021
TAGS: Reporting, Solver, profit margin, plant, report writer, Microsoft, manufacturing, template, practice, Acumatica, visualization, Netsuite, Finance, planning, profit, GP, dashboard, asset, Business Central, excel, ax, expense, forecast, Budget, Dynamics 365, analysis, budgeting, revenue, Cloud, Software, liability, Tableau, SAP, example, best, Sage, BC, D365, NAV, Intacct, facility, financial dashboard, Balance Sheet, CPM, report, SL, Management, dynamics, Power BI, income