
What is
a
n
Executive Dashboard for a Retail Company
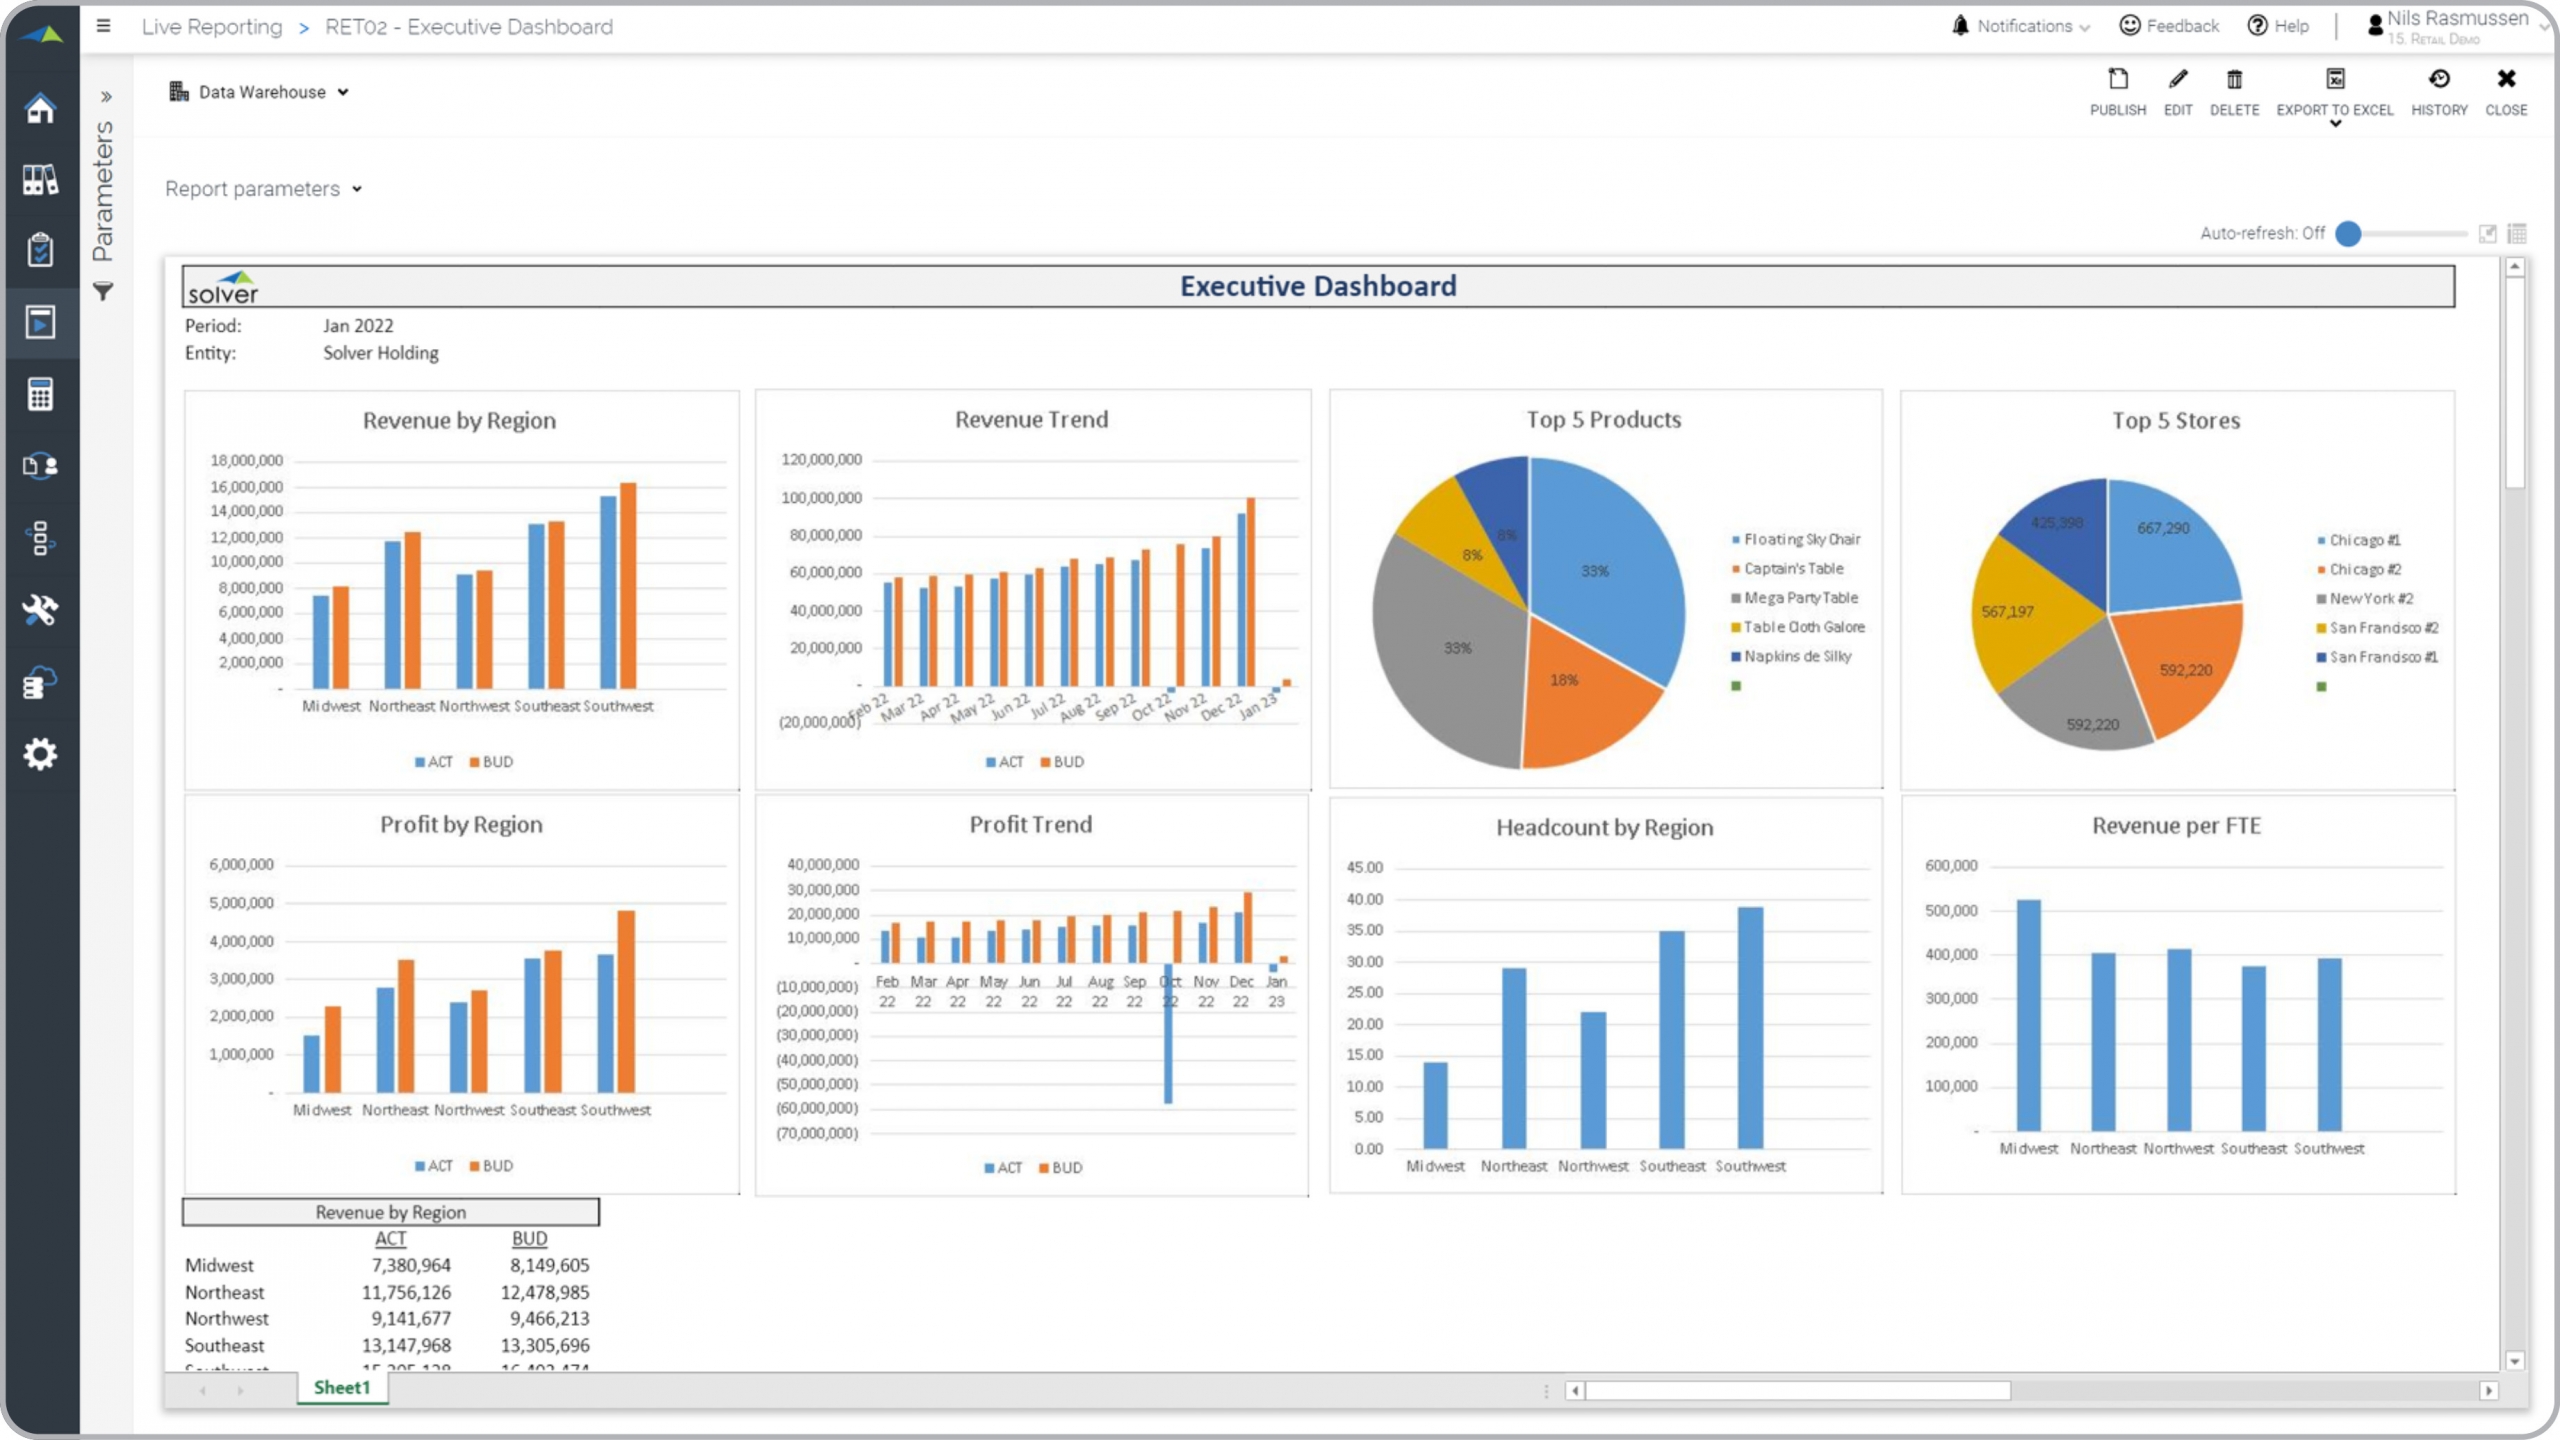
? Executive dashboards are considered essential management tools and are used by senior managers to analyze and monitor the key performance drivers of the company. Some of the main functionality in this type of dashboard is that it can be viewed for any period and retail entity. It contains eight charts that provides analysis of revenue, profit and headcount. These include Revenue by region, by month, by full time employee equivalent (FTE), as well as for the top products and top stores. Other charts display profit by region and monthly profit trend. You find an example of this type of dashboard below.
Purpose of
Executive Dashboards for Retailers Retailers use Executive Dashboards to make it easy for top management to analyze key performance indicators (KPIs) for the retail business. When used as part of good business practices in a Financial Planning & Analysis (FP&A) and Executive Department, a company can improve its speed and agility of decision-making as well as reduce the chances that executives operate in the dark because of lack of real-time, self-service analysis.
Executive Dashboards for a Retailer
- Example Here is an example of a Dashboard for Retail Executives with comparative and trend analysis. [caption id="" align="alignnone" width="2560"]
 Example of an Executive Dashboard for a Retail Company[/caption] You can find hundreds of additional examples
here
Who Uses This Type of
Dashboard
? The typical users of this type of dashboard are: Retail executives, board members, regional managers.
Other
Dashboard
s Often Used in Conjunction with
Executive Dashboards for Retailers Progressive Financial Planning & Analysis (FP&A) and Executive departments sometimes use several different Executive Dashboards for Retailers, along with general sales forecasts and budgets, balance sheets, cash flow statements and other management and control tools.
Where Does the Data for Analysis Originate From? The Actual (historical transactions) data typically comes from management systems or enterprise resource planning (ERP) systems like: Microsoft Dynamics 365 (D365) Finance, Microsoft Dynamics 365 Business Central (D365 BC), Microsoft Dynamics AX, Microsoft Dynamics NAV, Microsoft Dynamics GP, Microsoft Dynamics SL, Sage Intacct, Sage 100, Sage 300, Sage 500, Sage X3, SAP Business One, SAP ByDesign, Acumatica, Netsuite and others. In analyses where budgets or forecasts are used, the planning data most often originates from in-house Excel spreadsheet models or from professional corporate performance management (CPM/EPM) solutions.
What Tools are Typically used for Reporting, Planning and Dashboards? Examples of business software used with the data and ERPs mentioned above are:
Example of an Executive Dashboard for a Retail Company[/caption] You can find hundreds of additional examples
here
Who Uses This Type of
Dashboard
? The typical users of this type of dashboard are: Retail executives, board members, regional managers.
Other
Dashboard
s Often Used in Conjunction with
Executive Dashboards for Retailers Progressive Financial Planning & Analysis (FP&A) and Executive departments sometimes use several different Executive Dashboards for Retailers, along with general sales forecasts and budgets, balance sheets, cash flow statements and other management and control tools.
Where Does the Data for Analysis Originate From? The Actual (historical transactions) data typically comes from management systems or enterprise resource planning (ERP) systems like: Microsoft Dynamics 365 (D365) Finance, Microsoft Dynamics 365 Business Central (D365 BC), Microsoft Dynamics AX, Microsoft Dynamics NAV, Microsoft Dynamics GP, Microsoft Dynamics SL, Sage Intacct, Sage 100, Sage 300, Sage 500, Sage X3, SAP Business One, SAP ByDesign, Acumatica, Netsuite and others. In analyses where budgets or forecasts are used, the planning data most often originates from in-house Excel spreadsheet models or from professional corporate performance management (CPM/EPM) solutions.
What Tools are Typically used for Reporting, Planning and Dashboards? Examples of business software used with the data and ERPs mentioned above are:
- Native ERP report writers and query tools
- Spreadsheets (for example Microsoft Excel)
- Corporate Performance Management (CPM) tools (for example Solver)
- Dashboards (for example Microsoft Power BI and Tableau)
- View 100’s of reporting, consolidations, planning, budgeting, forecasting and dashboard examples here
- Read more about Retail solutions here
- See how reports are designed in a modern report writer using a cloud-connected Excel add-in writer
- Discover how the Solver CPM solution delivers financial and operational reporting
- Discover how the Solver CPM solution delivers planning, budgeting and forecasting
- Watch demo videos of reporting, planning and dashboards
January 18, 2021
TAGS: Reporting, Solver, report writer, Microsoft, template, practice, Acumatica, retail dashboard, Netsuite, executive, Finance, planning, profit, GP, dashboard, executive dashboard, Business Central, excel, ax, forecast, Budget, Dynamics 365, analysis, budgeting, FTE, KPI, revenue, Cloud, Software, Tableau, SAP, example, best, Sage, BC, store, D365, NAV, Intacct, chain, Retail, CPM, report, SL, Management, dynamics, Power BI