
What is an
Event Profit & Loss Budget
? Event profit & Loss (P&L) budgets are considered financial planning tools and are used by event- and budgeting managers to create revenue and expense budgets at the general ledger (GL) level. Some of the main functionality in this type of input form is that it allows for full P&L budgets by event. Using automated drivers as well as user input, the template enables input with full security and from anywhere with only a web browser required on the user's computer. You find an example of this type of input form below.
Purpose of
Event P&L Budgets Sports organizations use Event P&L Budgets to enable managers to plan financial outcomes per event and to see such budgets consolidated across all events.. When used as part of good business practices in Budgeting and Accounting departments, a company can improve its planning accuracy and it can maximize profitability through well-informed strategic decisions, and it can reduce the chances that costly mistakes, such as overstaffing or understaffing, takes place.
Example of a
Event P&L Budget Here is an example of an Event P&L Budget Input form with drivers and attendance statistics. [caption id="" align="alignnone" width="2560"]
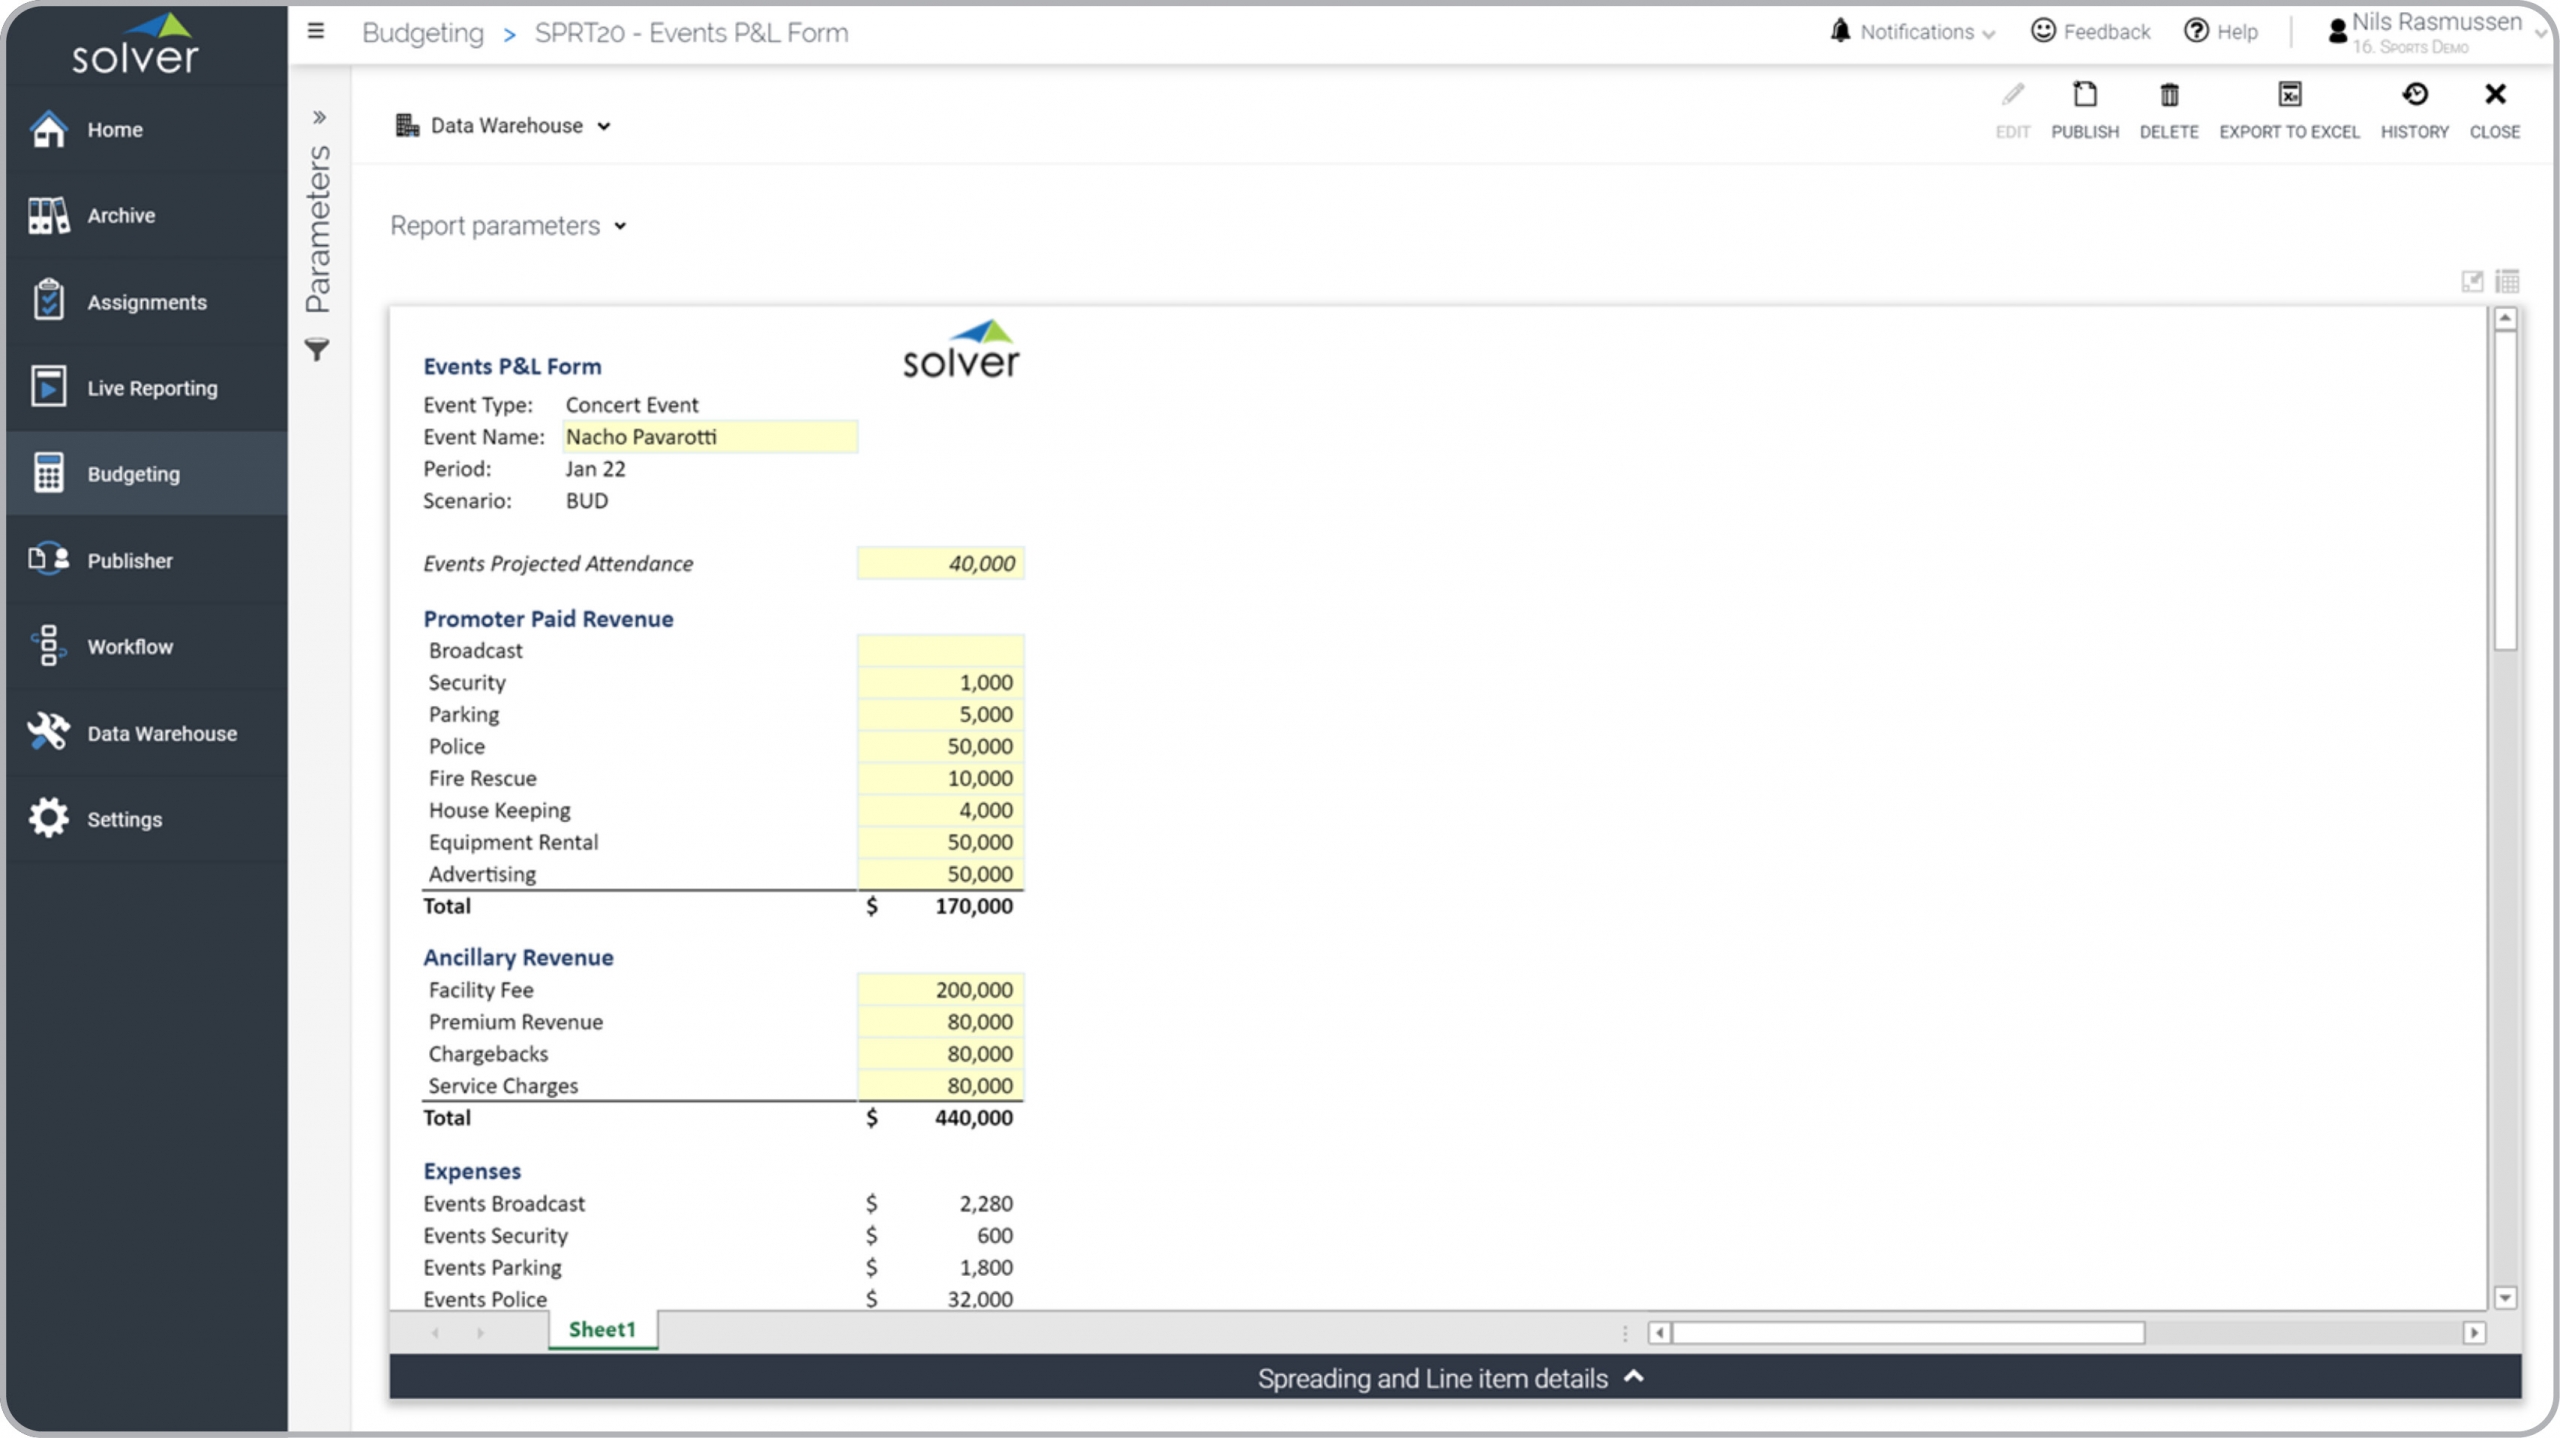 Example of an Event Profit & Loss Budget for Venues and Professional Sports Teams[/caption] You can find hundreds of additional examples
here
Who Uses This Type of
Input form
? The typical users of this type of input form are: CFOs, budget managers, event managers, staffing managers.
Other Reports Often Used in Conjunction with
Event P&L Budgets Progressive Budgeting and Accounting departments sometimes use several different Event P&L Budgets, along with expense budget forms, detailed revenue and staffing budgets, event dashboards, revenue dashboards, actual versus budget variance reports, consolidated P&L reports across all events and other management and control tools.
Where Does the Data for Analysis Originate From? The Actual (historical transactions) data typically comes from enterprise resource planning (ERP) systems like: Microsoft Dynamics 365 (D365) Finance, Microsoft Dynamics 365 Business Central (D365 BC), Microsoft Dynamics AX, Microsoft Dynamics NAV, Microsoft Dynamics GP, Microsoft Dynamics SL, Sage Intacct, Sage 100, Sage 300, Sage 500, Sage X3, SAP Business One, SAP ByDesign, Acumatica, Netsuite and others. In analyses where budgets or forecasts are used, the planning data most often originates from in-house Excel spreadsheet models or from professional corporate performance management (CPM/EPM) solutions.
What Tools are Typically used for Reporting, Planning and Dashboards? Examples of business software used with the data and ERPs mentioned above are:
Example of an Event Profit & Loss Budget for Venues and Professional Sports Teams[/caption] You can find hundreds of additional examples
here
Who Uses This Type of
Input form
? The typical users of this type of input form are: CFOs, budget managers, event managers, staffing managers.
Other Reports Often Used in Conjunction with
Event P&L Budgets Progressive Budgeting and Accounting departments sometimes use several different Event P&L Budgets, along with expense budget forms, detailed revenue and staffing budgets, event dashboards, revenue dashboards, actual versus budget variance reports, consolidated P&L reports across all events and other management and control tools.
Where Does the Data for Analysis Originate From? The Actual (historical transactions) data typically comes from enterprise resource planning (ERP) systems like: Microsoft Dynamics 365 (D365) Finance, Microsoft Dynamics 365 Business Central (D365 BC), Microsoft Dynamics AX, Microsoft Dynamics NAV, Microsoft Dynamics GP, Microsoft Dynamics SL, Sage Intacct, Sage 100, Sage 300, Sage 500, Sage X3, SAP Business One, SAP ByDesign, Acumatica, Netsuite and others. In analyses where budgets or forecasts are used, the planning data most often originates from in-house Excel spreadsheet models or from professional corporate performance management (CPM/EPM) solutions.
What Tools are Typically used for Reporting, Planning and Dashboards? Examples of business software used with the data and ERPs mentioned above are:
- Native ERP report writers and query tools
- Spreadsheets (for example Microsoft Excel)
- Corporate Performance Management (CPM) tools (for example Solver)
- Dashboards (for example Microsoft Power BI and Tableau)
- View 100’s of reporting, consolidations, planning, budgeting, forecasting and dashboard examples here
- View a Sports industry white paper and other industry-specific information here
- See how reports are designed in a modern report writer using a cloud-connected Excel add-in writer
- Discover how the Solver CPM solution delivers financial and operational reporting
- Discover how the Solver CPM solution delivers planning, budgeting and forecasting
- Watch demo videos of reporting, planning and dashboards
June 17, 2021
TAGS: Reporting, Solver, NPSL, report writer, Microsoft, NBA, template, practice, Acumatica, basketball, league, MLB, Netsuite, Finance, planning, GP, Business Central, excel, professional, ax, Sports, forecast, Budget, Dynamics 365, budgeting, professional sports, Cloud, Software, Tableau, SAP, NRL, example, NHL, NFL, best, Sage, BC, P&L, EPL, D365, MLS, NAV, Intacct, soccer, hockey, baseball, CPM, report, SL, Management, dynamics, football, Power BI, income, event budget, form, game, event