
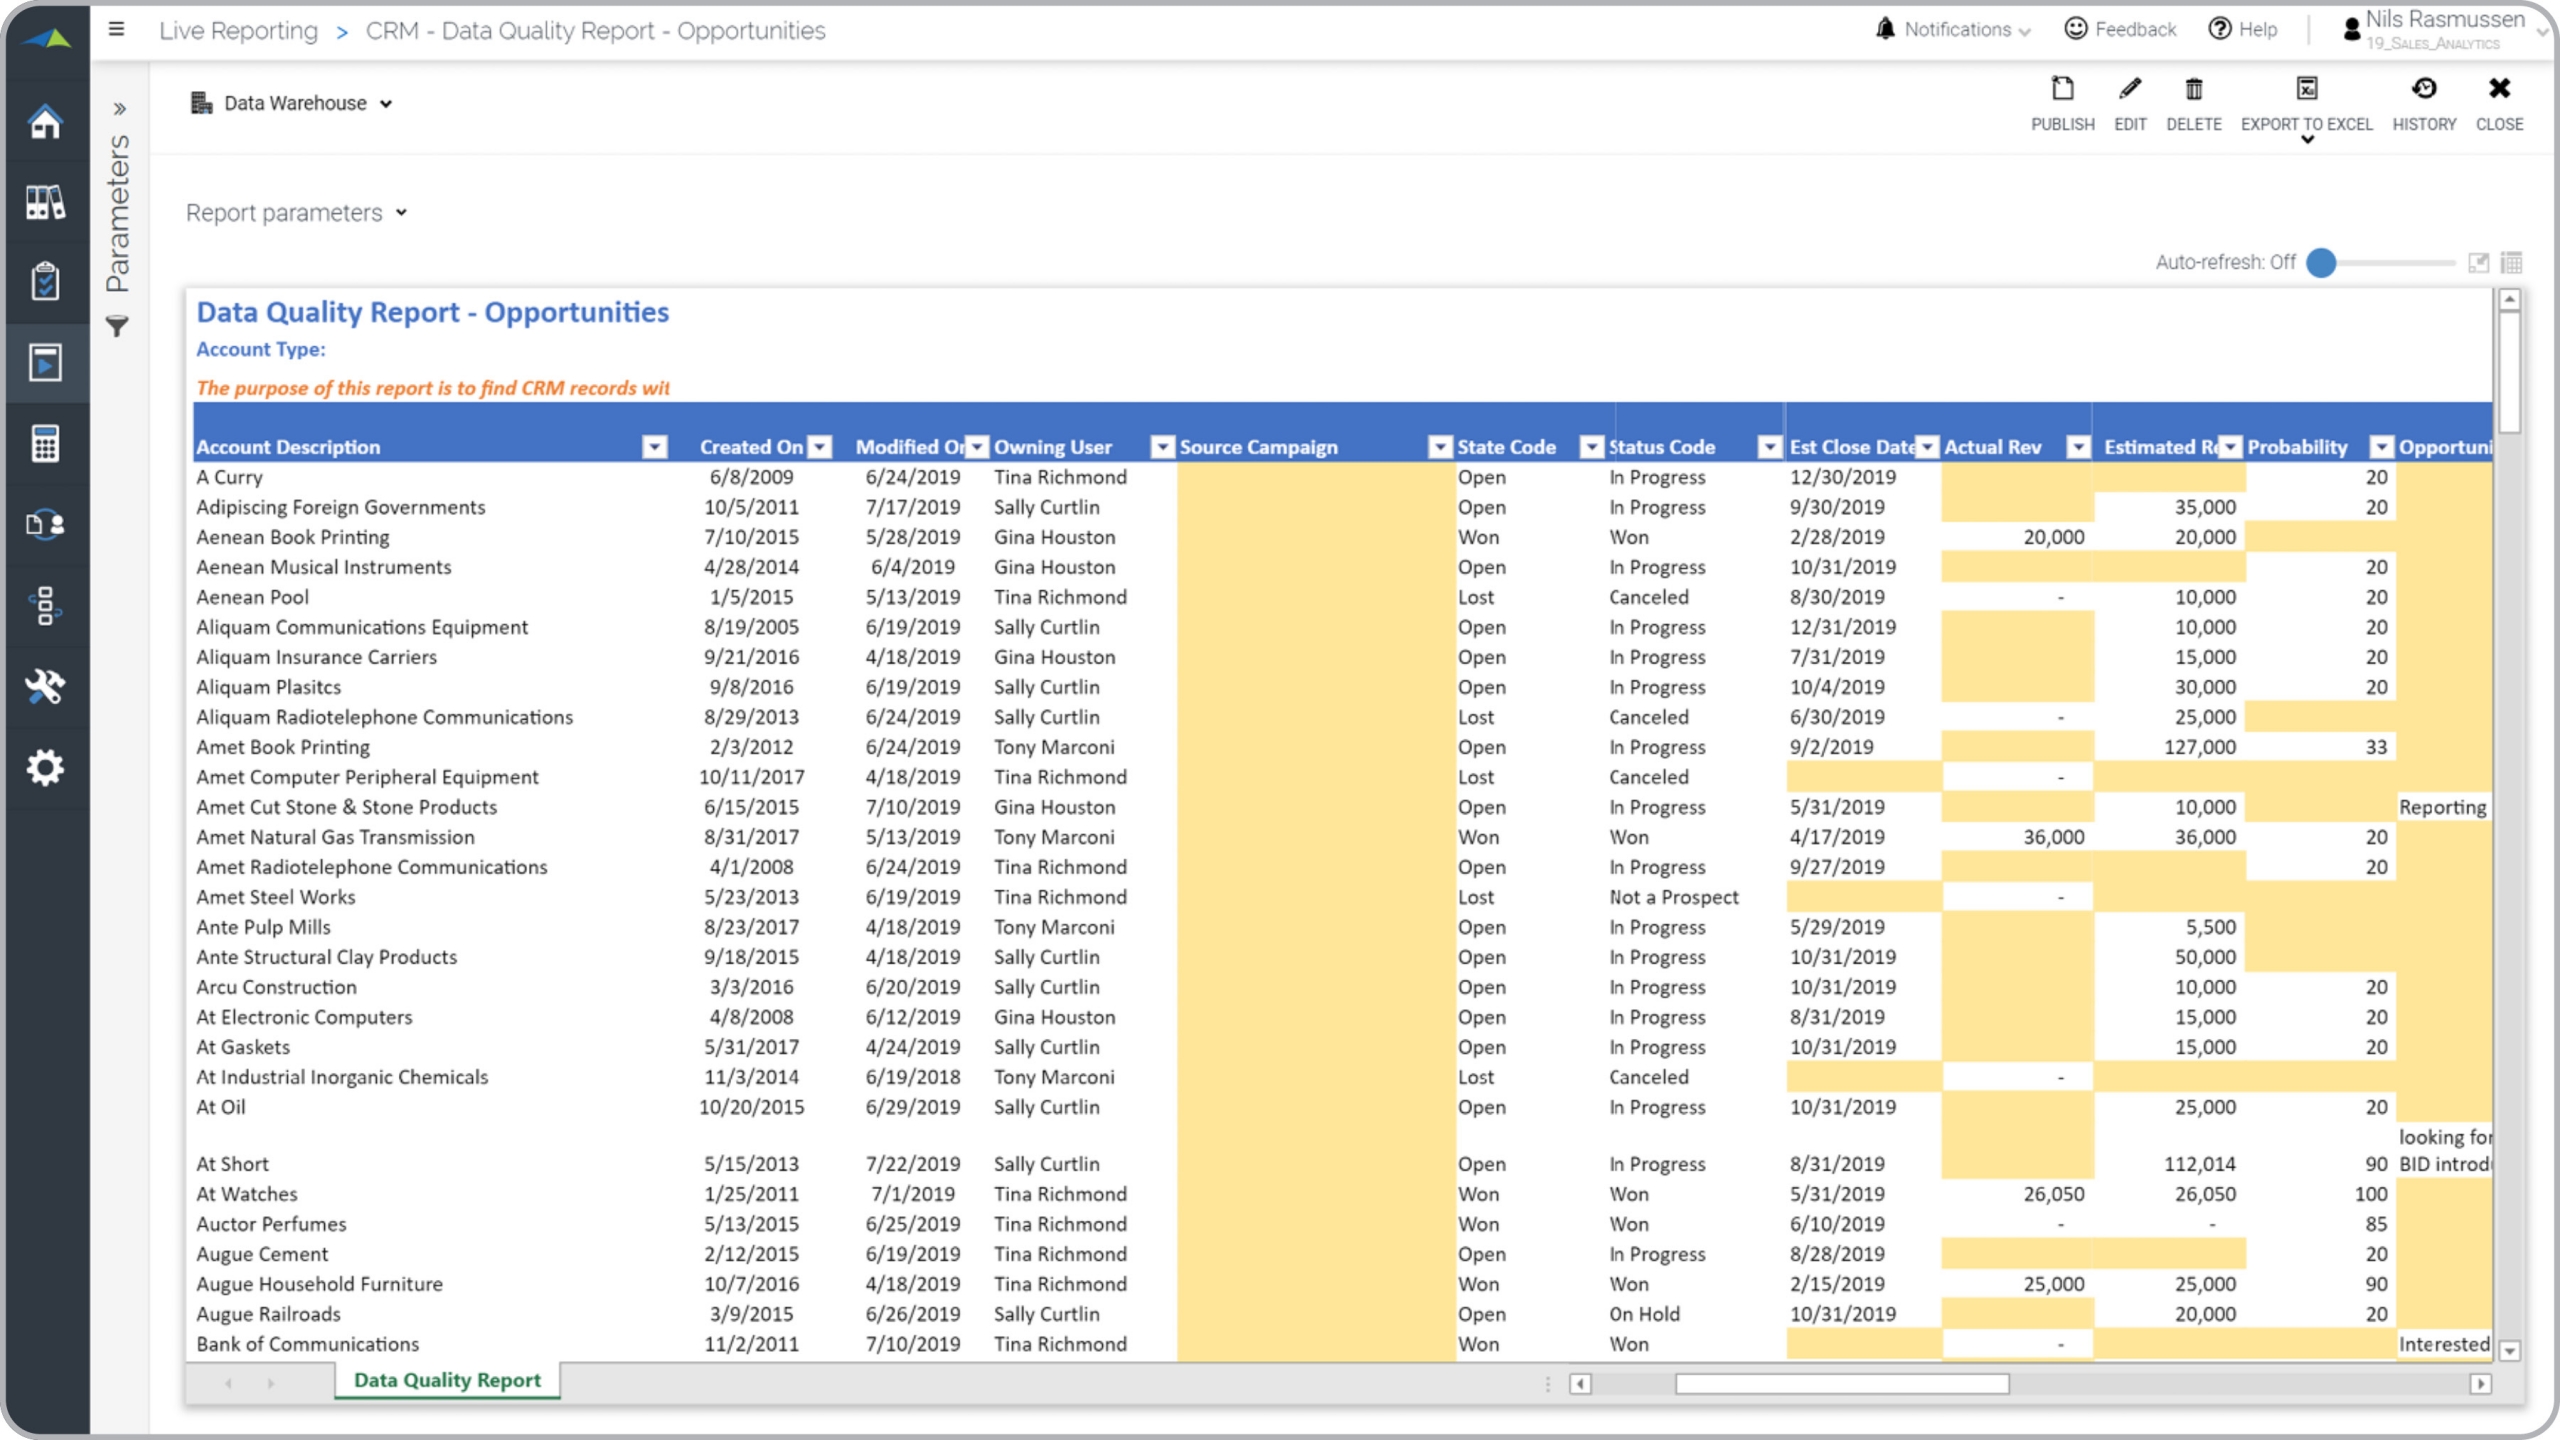
What is
a
CRM Data Quality Report
? Customer relationship management (CRM) data quality reports are considered control and audit tools. They are often used by sales and marketing managers to ensure that data that is manually entered or uploaded to the CRM system is correct and consistent. Some of the key functionality in this type of control report is that it uses yellow colors to highlight fields with missing information. It is also a convenient way to find information that is wrong or incomplete. This type of report can be used for data such as leads, opportunities, contacts and accounts. The example below is showing Opportunity data and the report has many other fields than what is visible in the example. You find an example of this type of control report below.
Purpose of
CRM Data Quality Reports Companies and organizations use CRM Data Quality Reports to help ensure that their sales and marketing teams populate CRM with as complete data as possible so that analysis, dashboards and reports are as correct as possible. When used as part of good business practices in a sales and marketing department, a company can improve its decision-making in areas such as campaign effectiveness and sales pipeline analysis as well as reduce the chances that poor data quality results in bad strategies and tactics.
CRM Data Quality Report
Example Here is an example of a CRM Data Quality Report. [caption id="" align="alignnone" width="2560"]
 CRM Data Quality Report Example[/caption] You can find hundreds of additional examples
here
Who Uses This Type of
Control report
? The typical users of this type of control report are: Sales and marketing managers, CRM administrators.
Other
Control report
s Often Used in Conjunction with
CRM Data Quality Reports Progressive sales and marketing Departments sometimes use several different CRM Data Quality Reports, along with data quality reports for leads, accounts and contacts, pipeline reports, campaign reports, opportunity reports and other management and control tools.
Where Does the Data for Analysis Originate From? The Actual (historical transactions) data typically comes from CRM systems and enterprise resource planning (ERP) systems like: Microsoft Dynamics 365 (D365) Finance, Microsoft Dynamics 365 Business Central (D365 BC), Microsoft Dynamics 365 (CRM), Microsoft Dynamics AX, Microsoft Dynamics NAV, Microsoft Dynamics GP, Microsoft Dynamics SL, Sage Intacct, Sage 100, Sage 300, Sage 500, Sage X3, SAP Business One, SAP ByDesign, Acumatica, Netsuite, Salesforce, Hubspot and others. In analyses where budgets or forecasts are used, the planning data most often originates from in-house Excel spreadsheet models or from professional corporate performance management (CPM/EPM) solutions.
What Tools are Typically used for Reporting, Planning and Dashboards? Examples of business software used with the data and ERPs mentioned above are:
CRM Data Quality Report Example[/caption] You can find hundreds of additional examples
here
Who Uses This Type of
Control report
? The typical users of this type of control report are: Sales and marketing managers, CRM administrators.
Other
Control report
s Often Used in Conjunction with
CRM Data Quality Reports Progressive sales and marketing Departments sometimes use several different CRM Data Quality Reports, along with data quality reports for leads, accounts and contacts, pipeline reports, campaign reports, opportunity reports and other management and control tools.
Where Does the Data for Analysis Originate From? The Actual (historical transactions) data typically comes from CRM systems and enterprise resource planning (ERP) systems like: Microsoft Dynamics 365 (D365) Finance, Microsoft Dynamics 365 Business Central (D365 BC), Microsoft Dynamics 365 (CRM), Microsoft Dynamics AX, Microsoft Dynamics NAV, Microsoft Dynamics GP, Microsoft Dynamics SL, Sage Intacct, Sage 100, Sage 300, Sage 500, Sage X3, SAP Business One, SAP ByDesign, Acumatica, Netsuite, Salesforce, Hubspot and others. In analyses where budgets or forecasts are used, the planning data most often originates from in-house Excel spreadsheet models or from professional corporate performance management (CPM/EPM) solutions.
What Tools are Typically used for Reporting, Planning and Dashboards? Examples of business software used with the data and ERPs mentioned above are:
- Native ERP report writers and query tools
- Spreadsheets (for example Microsoft Excel)
- Corporate Performance Management (CPM) tools (for example Solver)
- Dashboards (for example Microsoft Power BI and Tableau)
- View 100’s of reporting, consolidations, planning, budgeting, forecasting and dashboard examples here
- See how reports are designed in a modern report writer using a cloud-connected Excel add-in writer
- Discover how the Solver CPM solution delivers financial and operational reporting
- Discover how the Solver CPM solution delivers planning, budgeting and forecasting
- Watch demo videos of reporting, planning and dashboards
November 4, 2020
TAGS: Reporting, Solver, report writer, Microsoft, template, practice, Acumatica, Netsuite, Finance, GP, control, Business Central, excel, ax, Salesforce, forecast, Budget, forecasting, budgeting, Cloud, Software, Tableau, SAP, example, best, Sage, BC, D365, NAV, Intacct, CRM, CPM, report, SL, Management, dynamics, Power BI, audit, data quality