
What is
a
Consolidated Multi-level Profit & Loss Monthly Variance Report
? Consolidated Profit & Loss variance reports are considered corporate HQ analysis tools and are used by CFOs and Group Controllers to quickly review actual to budget variances from an HQ level and down to individual subsidiaries. Some of the key functionality in this type of report is that it automatically produces a multi-tab output based on a consolidation tree selected at run time. The top entity displays on the first tab, while divisions and their subsidiaries show on the following tabs. The user can drill down anywhere to see underlying transactions. You find an example of this type of report below.
Purpose of
Consolidated Multi-level Profit & Loss Variance Reports Companies and organizations use Consolidated Multi-level Profit & Loss Variance Reports to easily view both the corporate HQ results and those of their subsidiaries, and analyze variances at each level. When used as part of good business practices in a Finance & Accounting Department, a company can improve its organization-wide analysis as well as reduce the risk that corporate decision-makers lack insight to individual contributors to significant budget variances.
Consolidated Multi-level Profit & Loss Variance Report
Example Here is an example of a Consolidated Multi-level Profit & Loss Variance report with underlying subsidiary reports on each subsequent tab. [caption id="" align="alignnone" width="2560"]
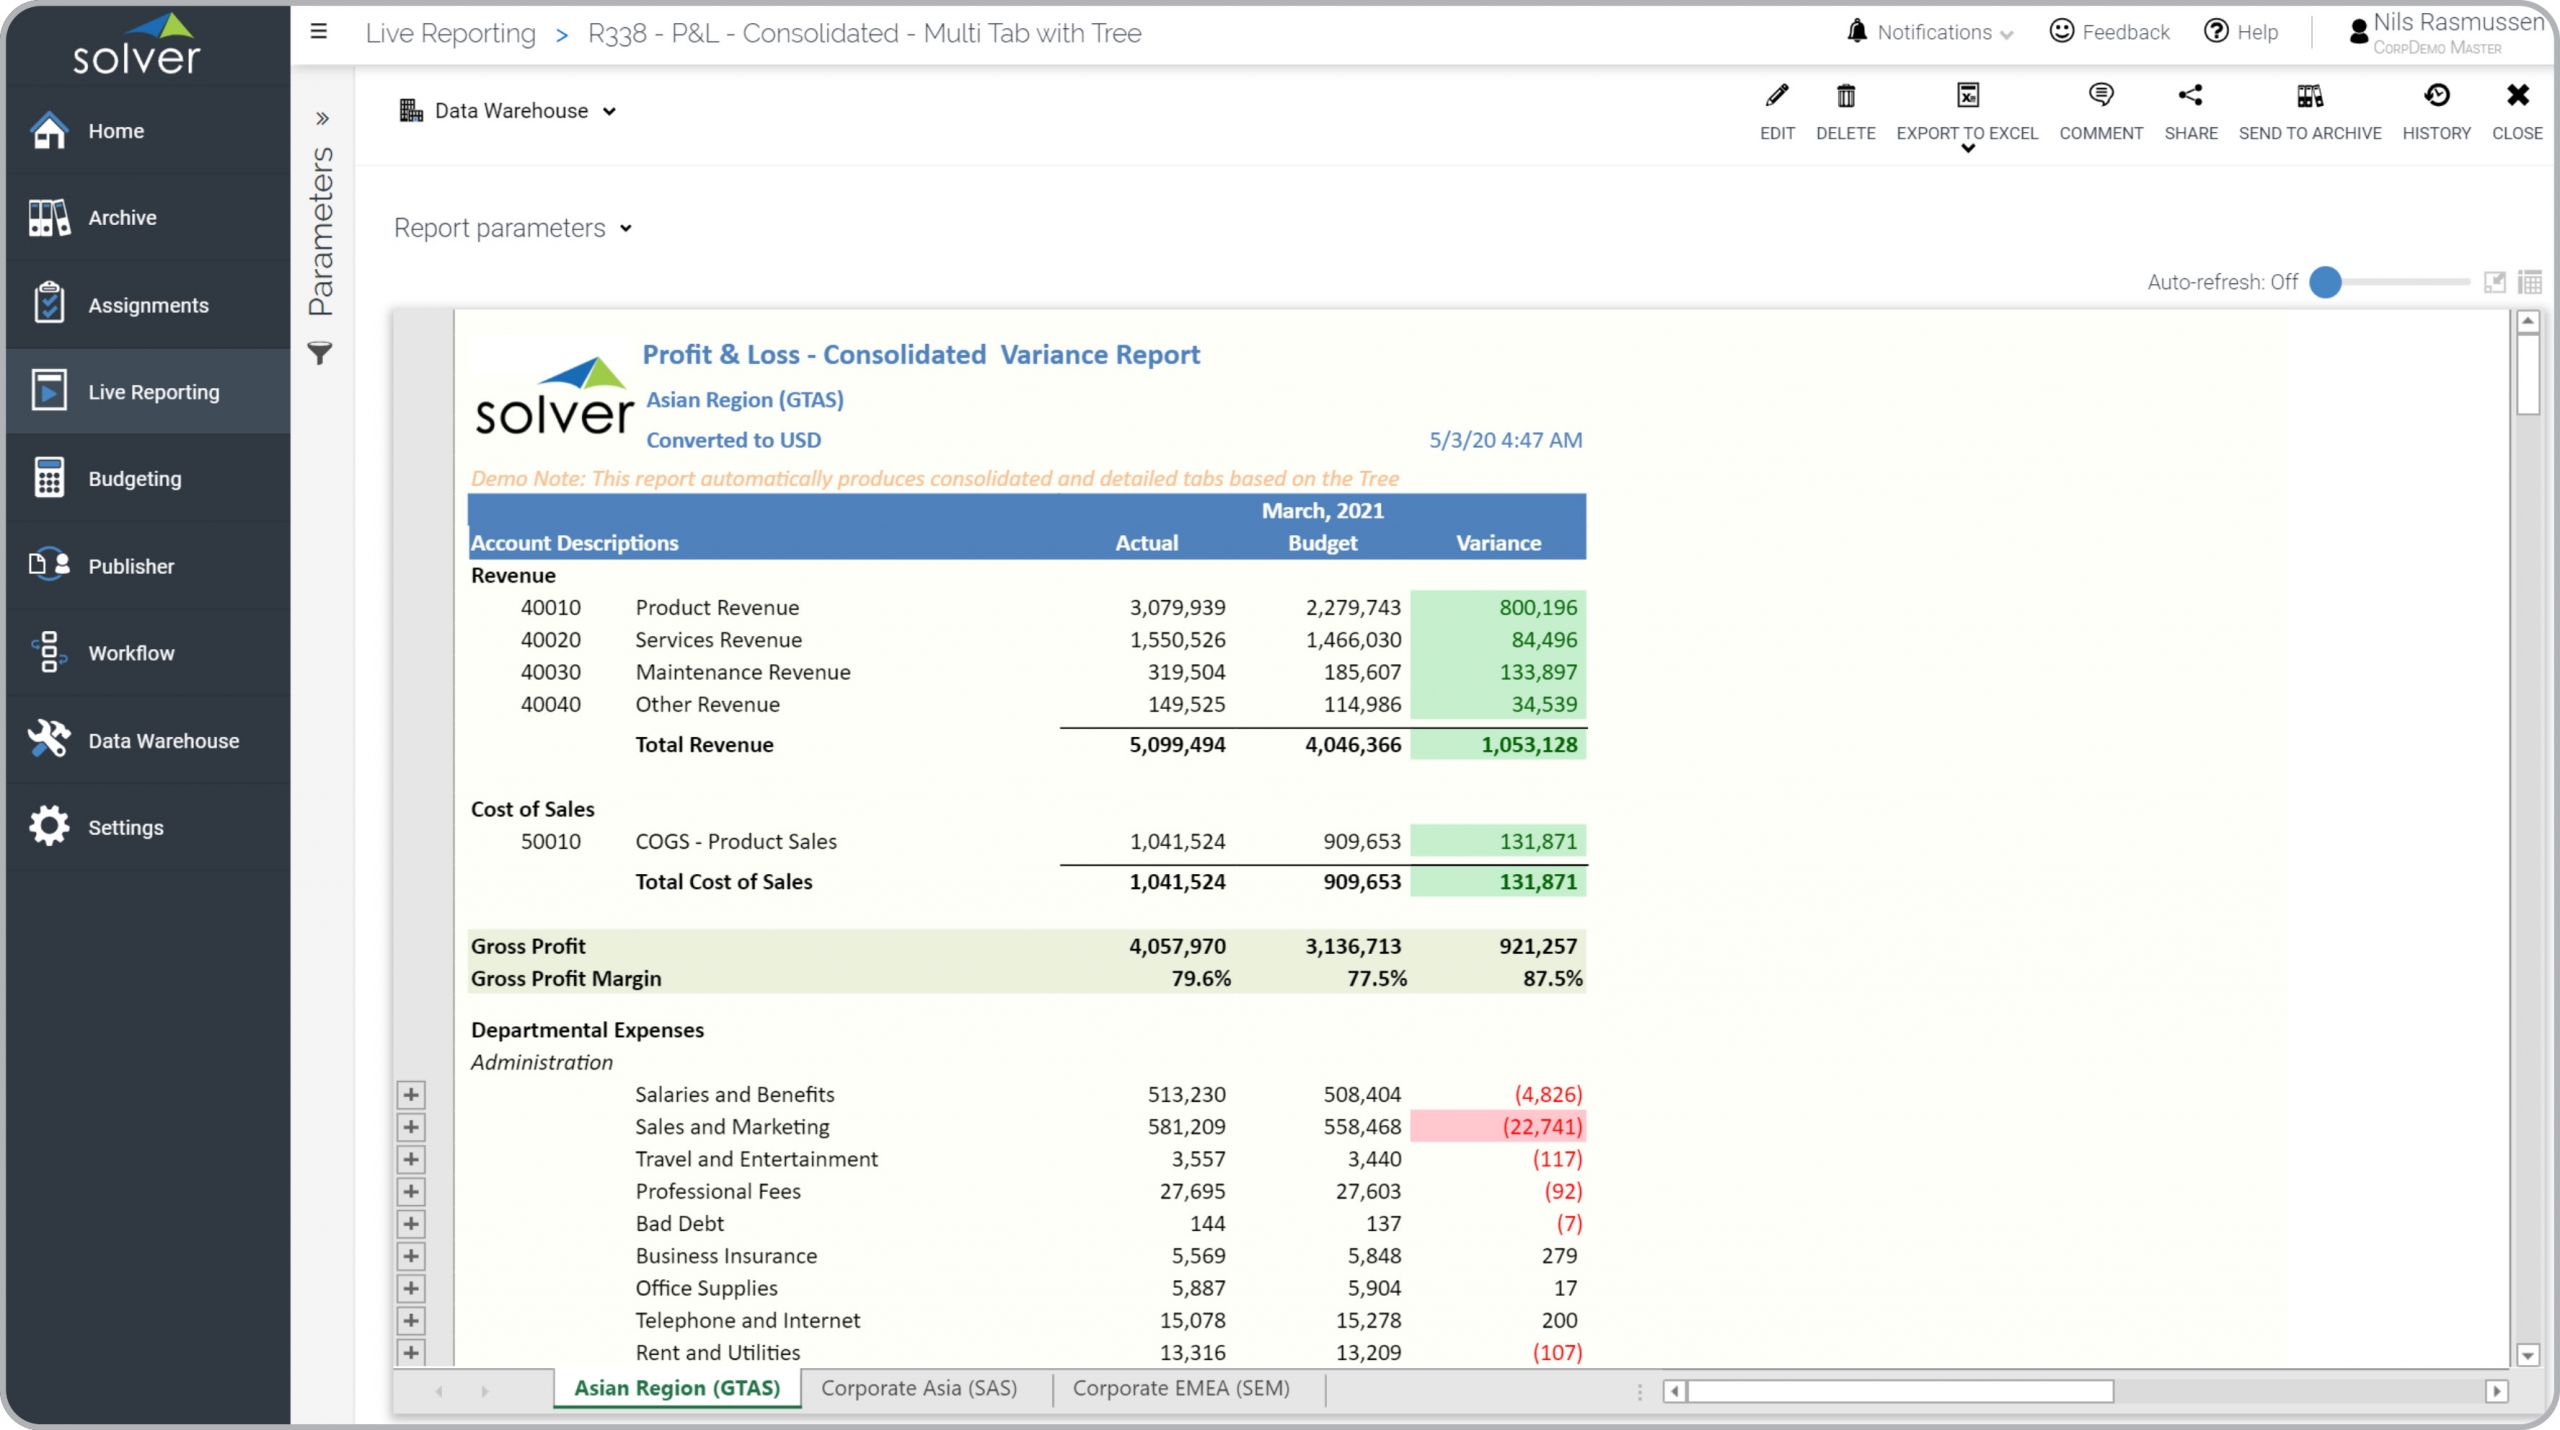 Consolidated Multi-level Profit & Loss Monthly Variance Report Example[/caption] You can find hundreds of additional examples
here
Who Uses This Type of
Report
? The typical users of this type of report are: Executives, CFOs and Controllers.
Other
Report
s Often Used in Conjunction with
Consolidated Multi-level Profit & Loss Variance Reports Progressive Finance & Accounting Departments sometimes use several different Consolidated Multi-level Profit & Loss Variance Reports, along with consolidated balance sheet and cash flow reports and other management and control tools.
Where Does the Data for Analysis Originate From? The Actual (historical transactions) data typically comes from enterprise resource planning (ERP) systems like: Microsoft Dynamics 365 (D365) Finance, Microsoft Dynamics 365 Business Central (D365 BC), Microsoft Dynamics AX, Microsoft Dynamics NAV, Microsoft Dynamics GP, Microsoft Dynamics SL, Sage Intacct, Sage 100, Sage 300, Sage 500, Sage X3, SAP Business One, SAP ByDesign, Acumatica, Netsuite and others. In analyses where budgets or forecasts are used, the planning data most often originates from in-house Excel spreadsheet models or from professional corporate performance management (CPM/EPM) solutions.
What Tools are Typically used for Reporting, Planning and Dashboards? Examples of business software used with the data and ERPs mentioned above are:
Consolidated Multi-level Profit & Loss Monthly Variance Report Example[/caption] You can find hundreds of additional examples
here
Who Uses This Type of
Report
? The typical users of this type of report are: Executives, CFOs and Controllers.
Other
Report
s Often Used in Conjunction with
Consolidated Multi-level Profit & Loss Variance Reports Progressive Finance & Accounting Departments sometimes use several different Consolidated Multi-level Profit & Loss Variance Reports, along with consolidated balance sheet and cash flow reports and other management and control tools.
Where Does the Data for Analysis Originate From? The Actual (historical transactions) data typically comes from enterprise resource planning (ERP) systems like: Microsoft Dynamics 365 (D365) Finance, Microsoft Dynamics 365 Business Central (D365 BC), Microsoft Dynamics AX, Microsoft Dynamics NAV, Microsoft Dynamics GP, Microsoft Dynamics SL, Sage Intacct, Sage 100, Sage 300, Sage 500, Sage X3, SAP Business One, SAP ByDesign, Acumatica, Netsuite and others. In analyses where budgets or forecasts are used, the planning data most often originates from in-house Excel spreadsheet models or from professional corporate performance management (CPM/EPM) solutions.
What Tools are Typically used for Reporting, Planning and Dashboards? Examples of business software used with the data and ERPs mentioned above are:
- Native ERP report writers and query tools
- Spreadsheets (for example Microsoft Excel)
- Corporate Performance Management (CPM) tools (for example Solver)
- Dashboards (for example Microsoft Power BI and Tableau)
- View 100’s of reporting, consolidations, planning, budgeting, forecasting and dashboard examples here
- Discover how the Solver CPM solution delivers financial and operational reporting
- Discover how the Solver CPM solution delivers planning, budgeting and forecasting
- Watch demo videos of reporting, planning and dashboards
July 21, 2020
TAGS: Reporting, Solver, report writer, Microsoft, consolidation, template, practice, Acumatica, Netsuite, Finance, Profit and Loss, GP, Business Central, excel, ax, income statement, budgeting, Cloud, Software, consolidated, Tableau, SAP, example, best, Sage, BC, P&L, D365, NAV, Intacct, monthly, Variance, CPM, report, SL, Management, dynamics, Power BI