
What is
a
n
Analysis by Call Code
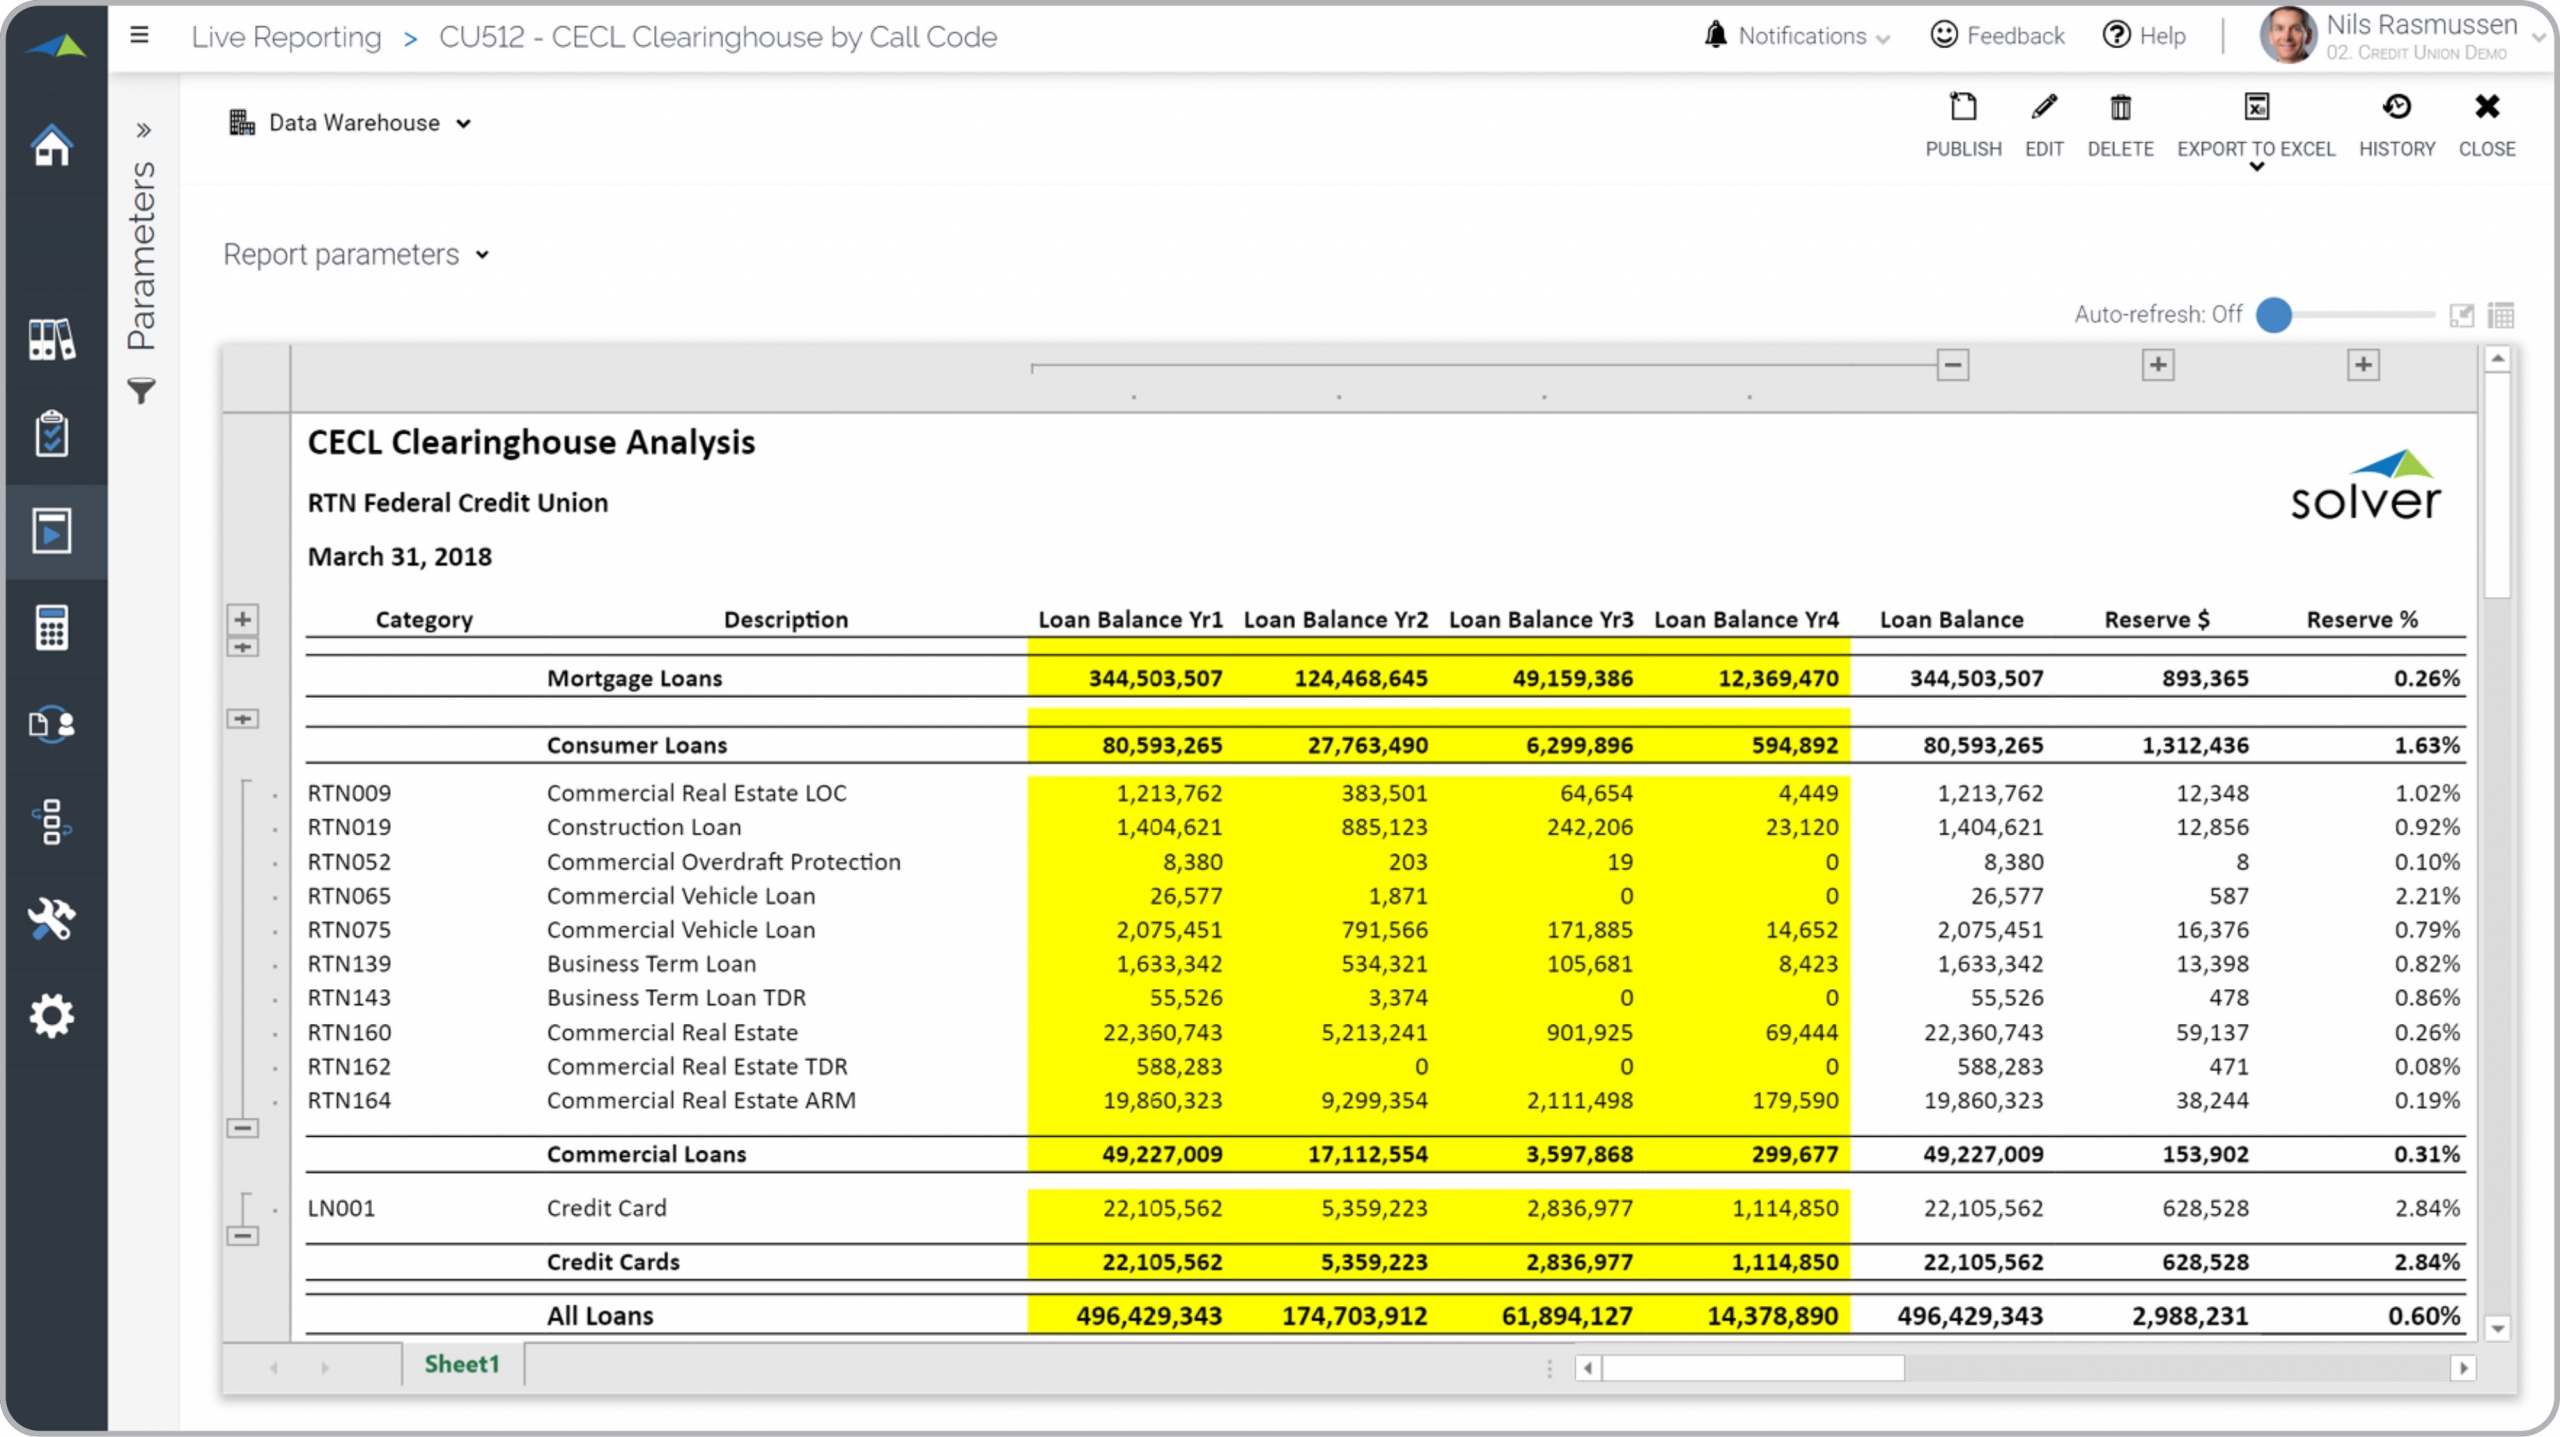
Report? Analysis by Call Code Reports are considered Current Expected Credit Losses (CECL) reports and are used by accountants and compliance managers to support them in their CECL reporting. Some of the main functionality in this type of report is that it can be run for any quarter (or month) and the rows list credit and loan products by account, including: Mortgage loans, consumer loans, commercial loans, credit cards, as well as a grand total. The columns show Loan balance, Annual reserves, Total reserves (amount) and Reserves (%). You find an example of this type of report below.
Purpose of
Analysis by Call Code Reports Credit Unions use Analysis by Call Code Reports to speed up and improve their CECL reporting. When used as part of good business practices in Accounting- and Compliance departments, a company can improve its CECL reporting processes and insights, and it can reduce the chances that there are mistakes in reported figures due to manual errors.
Example of an
Analysis by Call Code Report Here is an example of an Analysis by Call Code Report with products and totals listed down the rows and loan balances and reserves shown in the columns. [caption id="" align="alignnone" width="2560"]
 Credit Union – CECL Clearinghouse Analysis by Call Code Report[/caption] You can find hundreds of additional examples
here
Who Uses This Type of
Report
? The typical users of this type of report are: Accountants, compliance managers, CFOs.
Other Reports Often Used in Conjunction with
Analysis by Account Reports Progressive Accounting- and Compliance departments sometimes use several different Analysis by Call Code Reports, along with detailed loan reports, internal income statements, balance sheets, cash flow reports, trial balances, transaction detail reports and other management and control tools.
Where Does the Data for Analysis Originate From? The Actual (historical transactions) data typically comes from enterprise resource planning (ERP) systems like: Microsoft Dynamics 365 (D365) Finance, Microsoft Dynamics 365 Business Central (D365 BC), Microsoft Dynamics AX, Microsoft Dynamics NAV, Microsoft Dynamics GP, Microsoft Dynamics SL, Sage Intacct, Sage 100, Sage 300, Sage 500, Sage X3, SAP Business One, SAP ByDesign, Acumatica, Netsuite and others. In analyses where budgets or forecasts are used, the planning data most often originates from in-house Excel spreadsheet models or from professional corporate performance management (CPM/EPM) solutions.
What Tools are Typically used for Reporting, Planning and Dashboards? Examples of business software used with the data and ERPs mentioned above are:
Credit Union – CECL Clearinghouse Analysis by Call Code Report[/caption] You can find hundreds of additional examples
here
Who Uses This Type of
Report
? The typical users of this type of report are: Accountants, compliance managers, CFOs.
Other Reports Often Used in Conjunction with
Analysis by Account Reports Progressive Accounting- and Compliance departments sometimes use several different Analysis by Call Code Reports, along with detailed loan reports, internal income statements, balance sheets, cash flow reports, trial balances, transaction detail reports and other management and control tools.
Where Does the Data for Analysis Originate From? The Actual (historical transactions) data typically comes from enterprise resource planning (ERP) systems like: Microsoft Dynamics 365 (D365) Finance, Microsoft Dynamics 365 Business Central (D365 BC), Microsoft Dynamics AX, Microsoft Dynamics NAV, Microsoft Dynamics GP, Microsoft Dynamics SL, Sage Intacct, Sage 100, Sage 300, Sage 500, Sage X3, SAP Business One, SAP ByDesign, Acumatica, Netsuite and others. In analyses where budgets or forecasts are used, the planning data most often originates from in-house Excel spreadsheet models or from professional corporate performance management (CPM/EPM) solutions.
What Tools are Typically used for Reporting, Planning and Dashboards? Examples of business software used with the data and ERPs mentioned above are:
- Native ERP report writers and query tools
- Spreadsheets (for example Microsoft Excel)
- Corporate Performance Management (CPM) tools (for example Solver)
- Dashboards (for example Microsoft Power BI and Tableau)
- View 100’s of reporting, consolidations, planning, budgeting, forecasting and dashboard examples here
- View a Credit Union industry white paper and other industry-specific information here
- See how reports are designed in a modern report writer using a cloud-connected Excel add-in writer
- Discover how the Solver CPM solution delivers financial and operational reporting
- Discover how the Solver CPM solution delivers planning, budgeting and forecasting
- Watch demo videos of reporting, planning and dashboards
September 5, 2021
TAGS: Reporting, Solver, report writer, Microsoft, template, practice, Acumatica, Netsuite, Finance, credit union, planning, GP, fintech, Business Central, excel, ax, forecast, Budget, Dynamics 365, analysis, budgeting, bank, Cloud, Software, Tableau, SAP, example, best, Sage, BC, D365, NAV, Intacct, GL, financial institution, CPM, report, branch, SL, Management, dynamics, Power BI, allowance for loan and lease losses, clearinghouse, ALLL, FASB, CECL, call code