
What is a
Broadcast Revenue Report
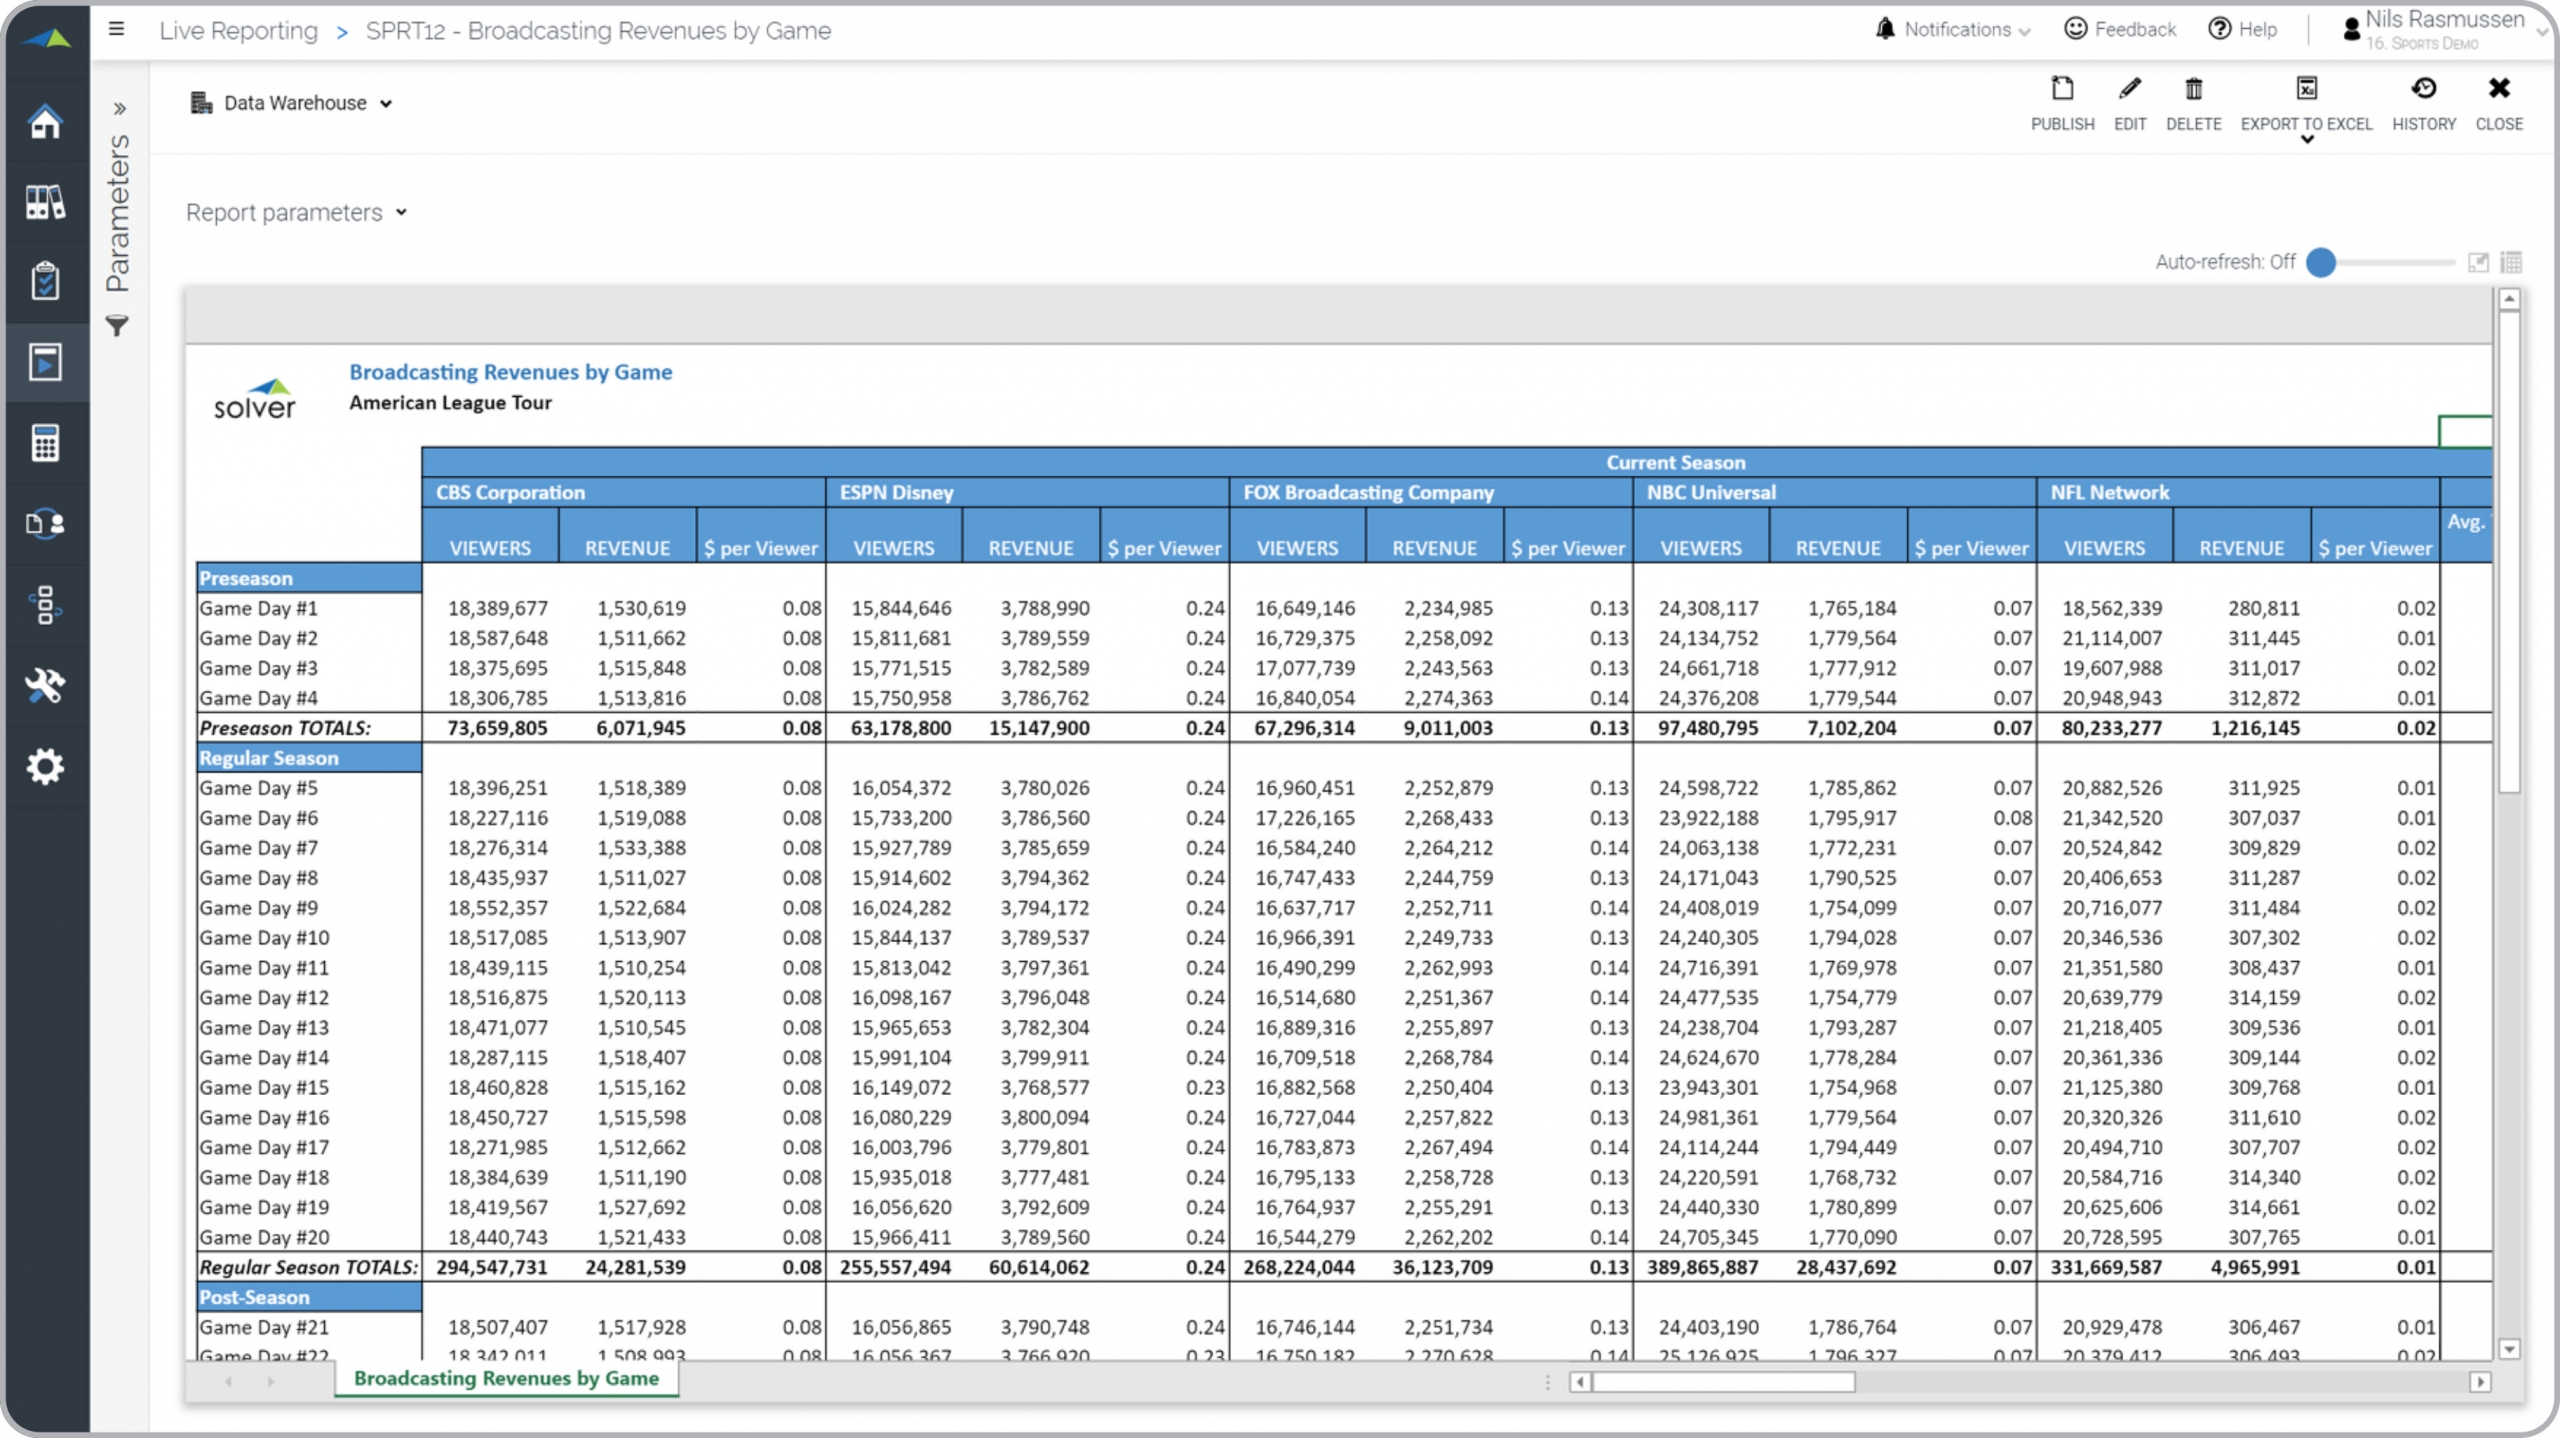
? Broadcast Revenue Reports are considered revenue and media analysis tools and are used by media- and revenue managers to analyze and compare detailed broadcast revenue metrics. Some of the main functionality in this type of report is that it shows detailed revenue and viewer figures per broadcaster and game. For each broadcaster (seen in the columns in the sample below) there are three columns: 1) Viewers, 2) Revenue and 3) Revenue per viewer. Games display down the rows with sub-totals by season. On the far right the report calculates the averages across all broadcasters. You find an example of this type of report below.
Purpose of
Broadcast Revenue Report
s Sports organizations use Broadcast Revenue Reports to give their managers a detailed picture of income and performance of each media partner. When used as part of good business practices in Broadcast Sales and FP&A departments, an organization can improve its media strategies and related broadcasting revenues, and it can reduce the chances that performance issues with underperforming media partners are not addressed in a timely manner.
Example of a
Broadcast Revenue Repor
t Here is an example of a Broadcast Revenue Report with detailed viewer and revenue metrics per game and broadcaster. [caption id="" align="alignnone" width="2560"]
 Example of a Broadcast Revenue Report for Professional Sports Teams[/caption] You can find hundreds of additional examples
here
Who Uses This Type of
Report
? The typical users of this type of report are: financial executives, accountants, media managers, sales managers.
Other Reports Often Used in Conjunction with
Broadcast Revenue Report Progressive Broadcast Sales and FP&A departments sometimes use several different Broadcast Revenue Reports, along with detailed transaction-level media revenue reports, reconciliation reports, media revenue budgets and forecasts, profit & loss reports and other management and control tools.
Where Does the Data for Analysis Originate From? The Actual (historical transactions) data typically comes from enterprise resource planning (ERP) systems like: Microsoft Dynamics 365 (D365) Finance, Microsoft Dynamics 365 Business Central (D365 BC), Microsoft Dynamics AX, Microsoft Dynamics NAV, Microsoft Dynamics GP, Microsoft Dynamics SL, Sage Intacct, Sage 100, Sage 300, Sage 500, Sage X3, SAP Business One, SAP ByDesign, Acumatica, Netsuite and others. In analyses where budgets or forecasts are used, the planning data most often originates from in-house Excel spreadsheet models or from professional corporate performance management (CPM/EPM) solutions.
What Tools are Typically used for Reporting, Planning and Dashboards? Examples of business software used with the data and ERPs mentioned above are:
Example of a Broadcast Revenue Report for Professional Sports Teams[/caption] You can find hundreds of additional examples
here
Who Uses This Type of
Report
? The typical users of this type of report are: financial executives, accountants, media managers, sales managers.
Other Reports Often Used in Conjunction with
Broadcast Revenue Report Progressive Broadcast Sales and FP&A departments sometimes use several different Broadcast Revenue Reports, along with detailed transaction-level media revenue reports, reconciliation reports, media revenue budgets and forecasts, profit & loss reports and other management and control tools.
Where Does the Data for Analysis Originate From? The Actual (historical transactions) data typically comes from enterprise resource planning (ERP) systems like: Microsoft Dynamics 365 (D365) Finance, Microsoft Dynamics 365 Business Central (D365 BC), Microsoft Dynamics AX, Microsoft Dynamics NAV, Microsoft Dynamics GP, Microsoft Dynamics SL, Sage Intacct, Sage 100, Sage 300, Sage 500, Sage X3, SAP Business One, SAP ByDesign, Acumatica, Netsuite and others. In analyses where budgets or forecasts are used, the planning data most often originates from in-house Excel spreadsheet models or from professional corporate performance management (CPM/EPM) solutions.
What Tools are Typically used for Reporting, Planning and Dashboards? Examples of business software used with the data and ERPs mentioned above are:
- Native ERP report writers and query tools
- Spreadsheets (for example Microsoft Excel)
- Corporate Performance Management (CPM) tools (for example Solver)
- Dashboards (for example Microsoft Power BI and Tableau)
- View 100’s of reporting, consolidations, planning, budgeting, forecasting and dashboard examples here
- View a Sports industry white paper and other industry-specific information here
- See how reports are designed in a modern report writer using a cloud-connected Excel add-in writer
- Discover how the Solver CPM solution delivers financial and operational reporting
- Discover how the Solver CPM solution delivers planning, budgeting and forecasting
- Watch demo videos of reporting, planning and dashboards
June 24, 2021
TAGS: Reporting, Solver, NPSL, report writer, Microsoft, NBA, template, practice, Acumatica, basketball, league, MLB, Netsuite, Finance, planning, GP, dashboard, Business Central, excel, professional, ax, Sports, forecast, Budget, Dynamics 365, budgeting, professional sports, Cloud, Software, Tableau, SAP, NRL, example, NHL, NFL, media, best, Sage, BC, EPL, D365, MLS, NAV, Intacct, soccer, hockey, baseball, CPM, report, SL, Management, dynamics, football, Power BI, game, broadcasting, revenue viewer, broadcast revenue report