
What is a
Benchmarking Dashboard
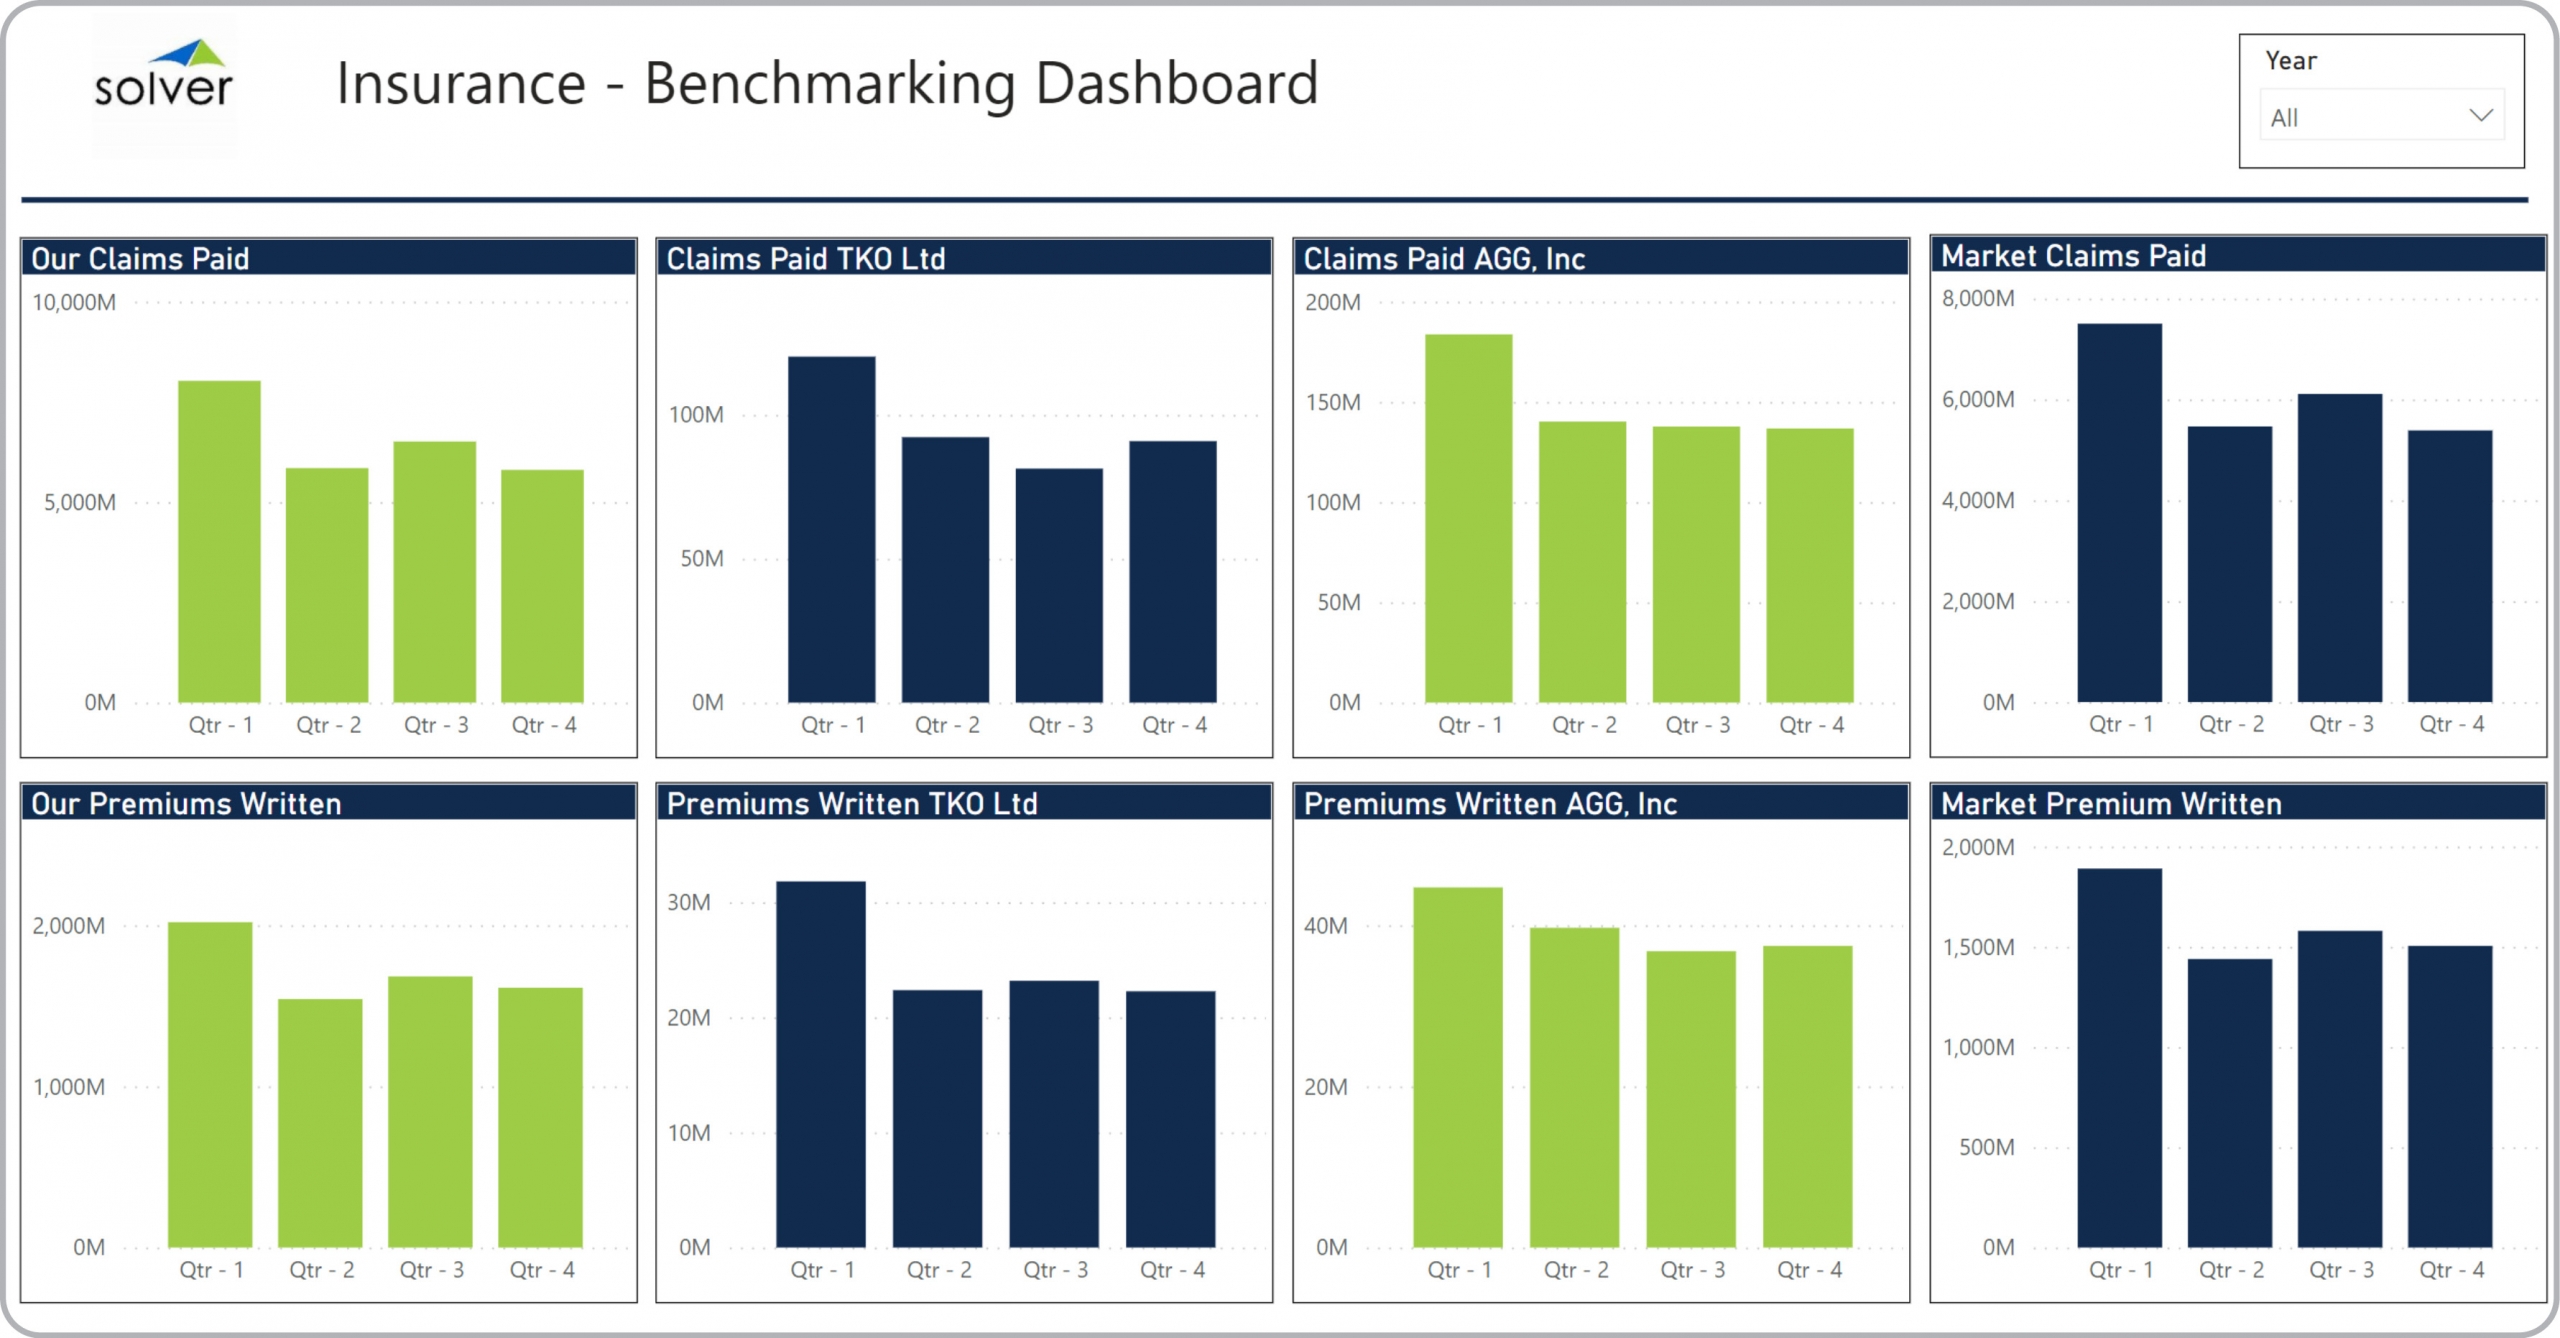
? Benchmarking Dashboard are considered comparison analysis tools and are used by Executives and Analysts to compare and contrast the company's KPIs against those of industry peers. Some of the main functionality in this type of dashboard is that it shows benchmarking of claims paid and premiums written, including for: Your own company, several selected competitors and the industry average. The time periods are quarters as that align with when public filings are available. You find an example of this type of dashboard below.
Purpose of
Benchmarking Dashboards
for Insurance Companies Insurance companies use Benchmarking Dashboards to monitor internal performance with that of the external marketplace, as well as to conduct reality checks on growth targets and other metrics. When used as part of good business practices in Financial Planning & Analysis (FP&A) departments, an organization can improve its strategic targets and related tactical decisions, and it can reduce the chances that a singular focus on internal metrics may sub-optimize planning processes.
Example of a
Benchmarking Dashboard Here is an example of a Benchmarking Dashboard with comparisons to select competitors as well as the industry average. [caption id="" align="alignnone" width="2560"]
 Example of a Benchmarking Dashboard for Insurance Companies[/caption] You can find hundreds of additional examples
here
Who Uses This Type of
Dashboard
? The typical users of this type of dashboard are: Executives, boards, CFO's, analysts.
Other Reports Often Used in Conjunction with
Benchmarking Dashboards Progressive Financial Planning & Analysis (FP&A) departments sometimes use several different Benchmarking Dashboards, along with financial reports, budgets, multi-year forecasts and other management and control tools.
Where Does the Data for Analysis Originate From? The external data typically comes from a web-site or database with public data such as EDGAR and Yahoo Finance. Internal data comes from enterprise resource planning (ERP) systems like: Microsoft Dynamics 365 (D365) Finance, Microsoft Dynamics 365 Business Central (D365 BC), Microsoft Dynamics AX, Microsoft Dynamics NAV, Microsoft Dynamics GP, Microsoft Dynamics SL, Sage Intacct, Sage 100, Sage 300, Sage 500, Sage X3, SAP Business One, SAP ByDesign, Acumatica, Netsuite and others. In analyses where budgets or forecasts are used, the planning data most often originates from in-house Excel spreadsheet models or from professional corporate performance management (CPM/EPM) solutions.
What Tools are Typically used for Reporting, Planning and Dashboards? Examples of business software used with the data and ERPs mentioned above are:
Example of a Benchmarking Dashboard for Insurance Companies[/caption] You can find hundreds of additional examples
here
Who Uses This Type of
Dashboard
? The typical users of this type of dashboard are: Executives, boards, CFO's, analysts.
Other Reports Often Used in Conjunction with
Benchmarking Dashboards Progressive Financial Planning & Analysis (FP&A) departments sometimes use several different Benchmarking Dashboards, along with financial reports, budgets, multi-year forecasts and other management and control tools.
Where Does the Data for Analysis Originate From? The external data typically comes from a web-site or database with public data such as EDGAR and Yahoo Finance. Internal data comes from enterprise resource planning (ERP) systems like: Microsoft Dynamics 365 (D365) Finance, Microsoft Dynamics 365 Business Central (D365 BC), Microsoft Dynamics AX, Microsoft Dynamics NAV, Microsoft Dynamics GP, Microsoft Dynamics SL, Sage Intacct, Sage 100, Sage 300, Sage 500, Sage X3, SAP Business One, SAP ByDesign, Acumatica, Netsuite and others. In analyses where budgets or forecasts are used, the planning data most often originates from in-house Excel spreadsheet models or from professional corporate performance management (CPM/EPM) solutions.
What Tools are Typically used for Reporting, Planning and Dashboards? Examples of business software used with the data and ERPs mentioned above are:
- Native ERP report writers and query tools
- Spreadsheets (for example Microsoft Excel)
- Corporate Performance Management (CPM) tools (for example Solver)
- Dashboards (for example Microsoft Power BI and Tableau)
- View 100’s of reporting, consolidations, planning, budgeting, forecasting and dashboard examples here
- View an Insurance industry white paper and other industry-specific information here
- See how reports are designed in a modern report writer using a cloud-connected Excel add-in writer
- Discover how the Solver CPM solution delivers financial and operational reporting
- Discover how the Solver CPM solution delivers planning, budgeting and forecasting
- Watch demo videos of reporting, planning and dashboards
May 17, 2021
TAGS: Reporting, Solver, insurance, report writer, Microsoft, benchmark, template, practice, Acumatica, Netsuite, Finance, comparison, planning, GP, dashboard, fintech, Business Central, excel, ax, forecast, Budget, Dynamics 365, analysis, budgeting, KPI, Cloud, Software, Tableau, SAP, example, best, Sage, BC, D365, NAV, Intacct, CPM, report, SL, Management, dynamics, Power BI, competitor, benchmarking dashboard, claims paid, industry comparison, premiums written