
What is a
Bank Financing Dashboard
? Bank Financing Dashboards are considered bank analysis tools and are used by real estate finance teams and managers of developments projects to look at sales data and related bank financing. Some of the main functionality in this type of dashboard is that it is run on a monthly basis and includes analysis from four different perspectives: 1) Monthly sales trend with actual compared to budget, 2) Top 5 banks used, 3) Units sold trend, and 4) Bank financed sales with current year compared to prior year. You find an example of this type of dashboard below.
Purpose of
Bank Financing Dashboards Real Estate companies use Bank Financing Dashboards to give their leaders an easy way to analyze how much they work with various banks in the projects development and/or sales process. When used as part of good business practices in Sales and Financial Planning and Analysis (FP&A) departments, a company can improve its financing and sales strategies, and it can reduce the chances that the most important bank relationships are not getting the attention they should have.
Example of a
Bank Financing Dashboard Here is an example of a Bank Financing Dashboard with comparison to prior year as well as views of monthly property/unit sales. [caption id="" align="alignnone" width="2560"]
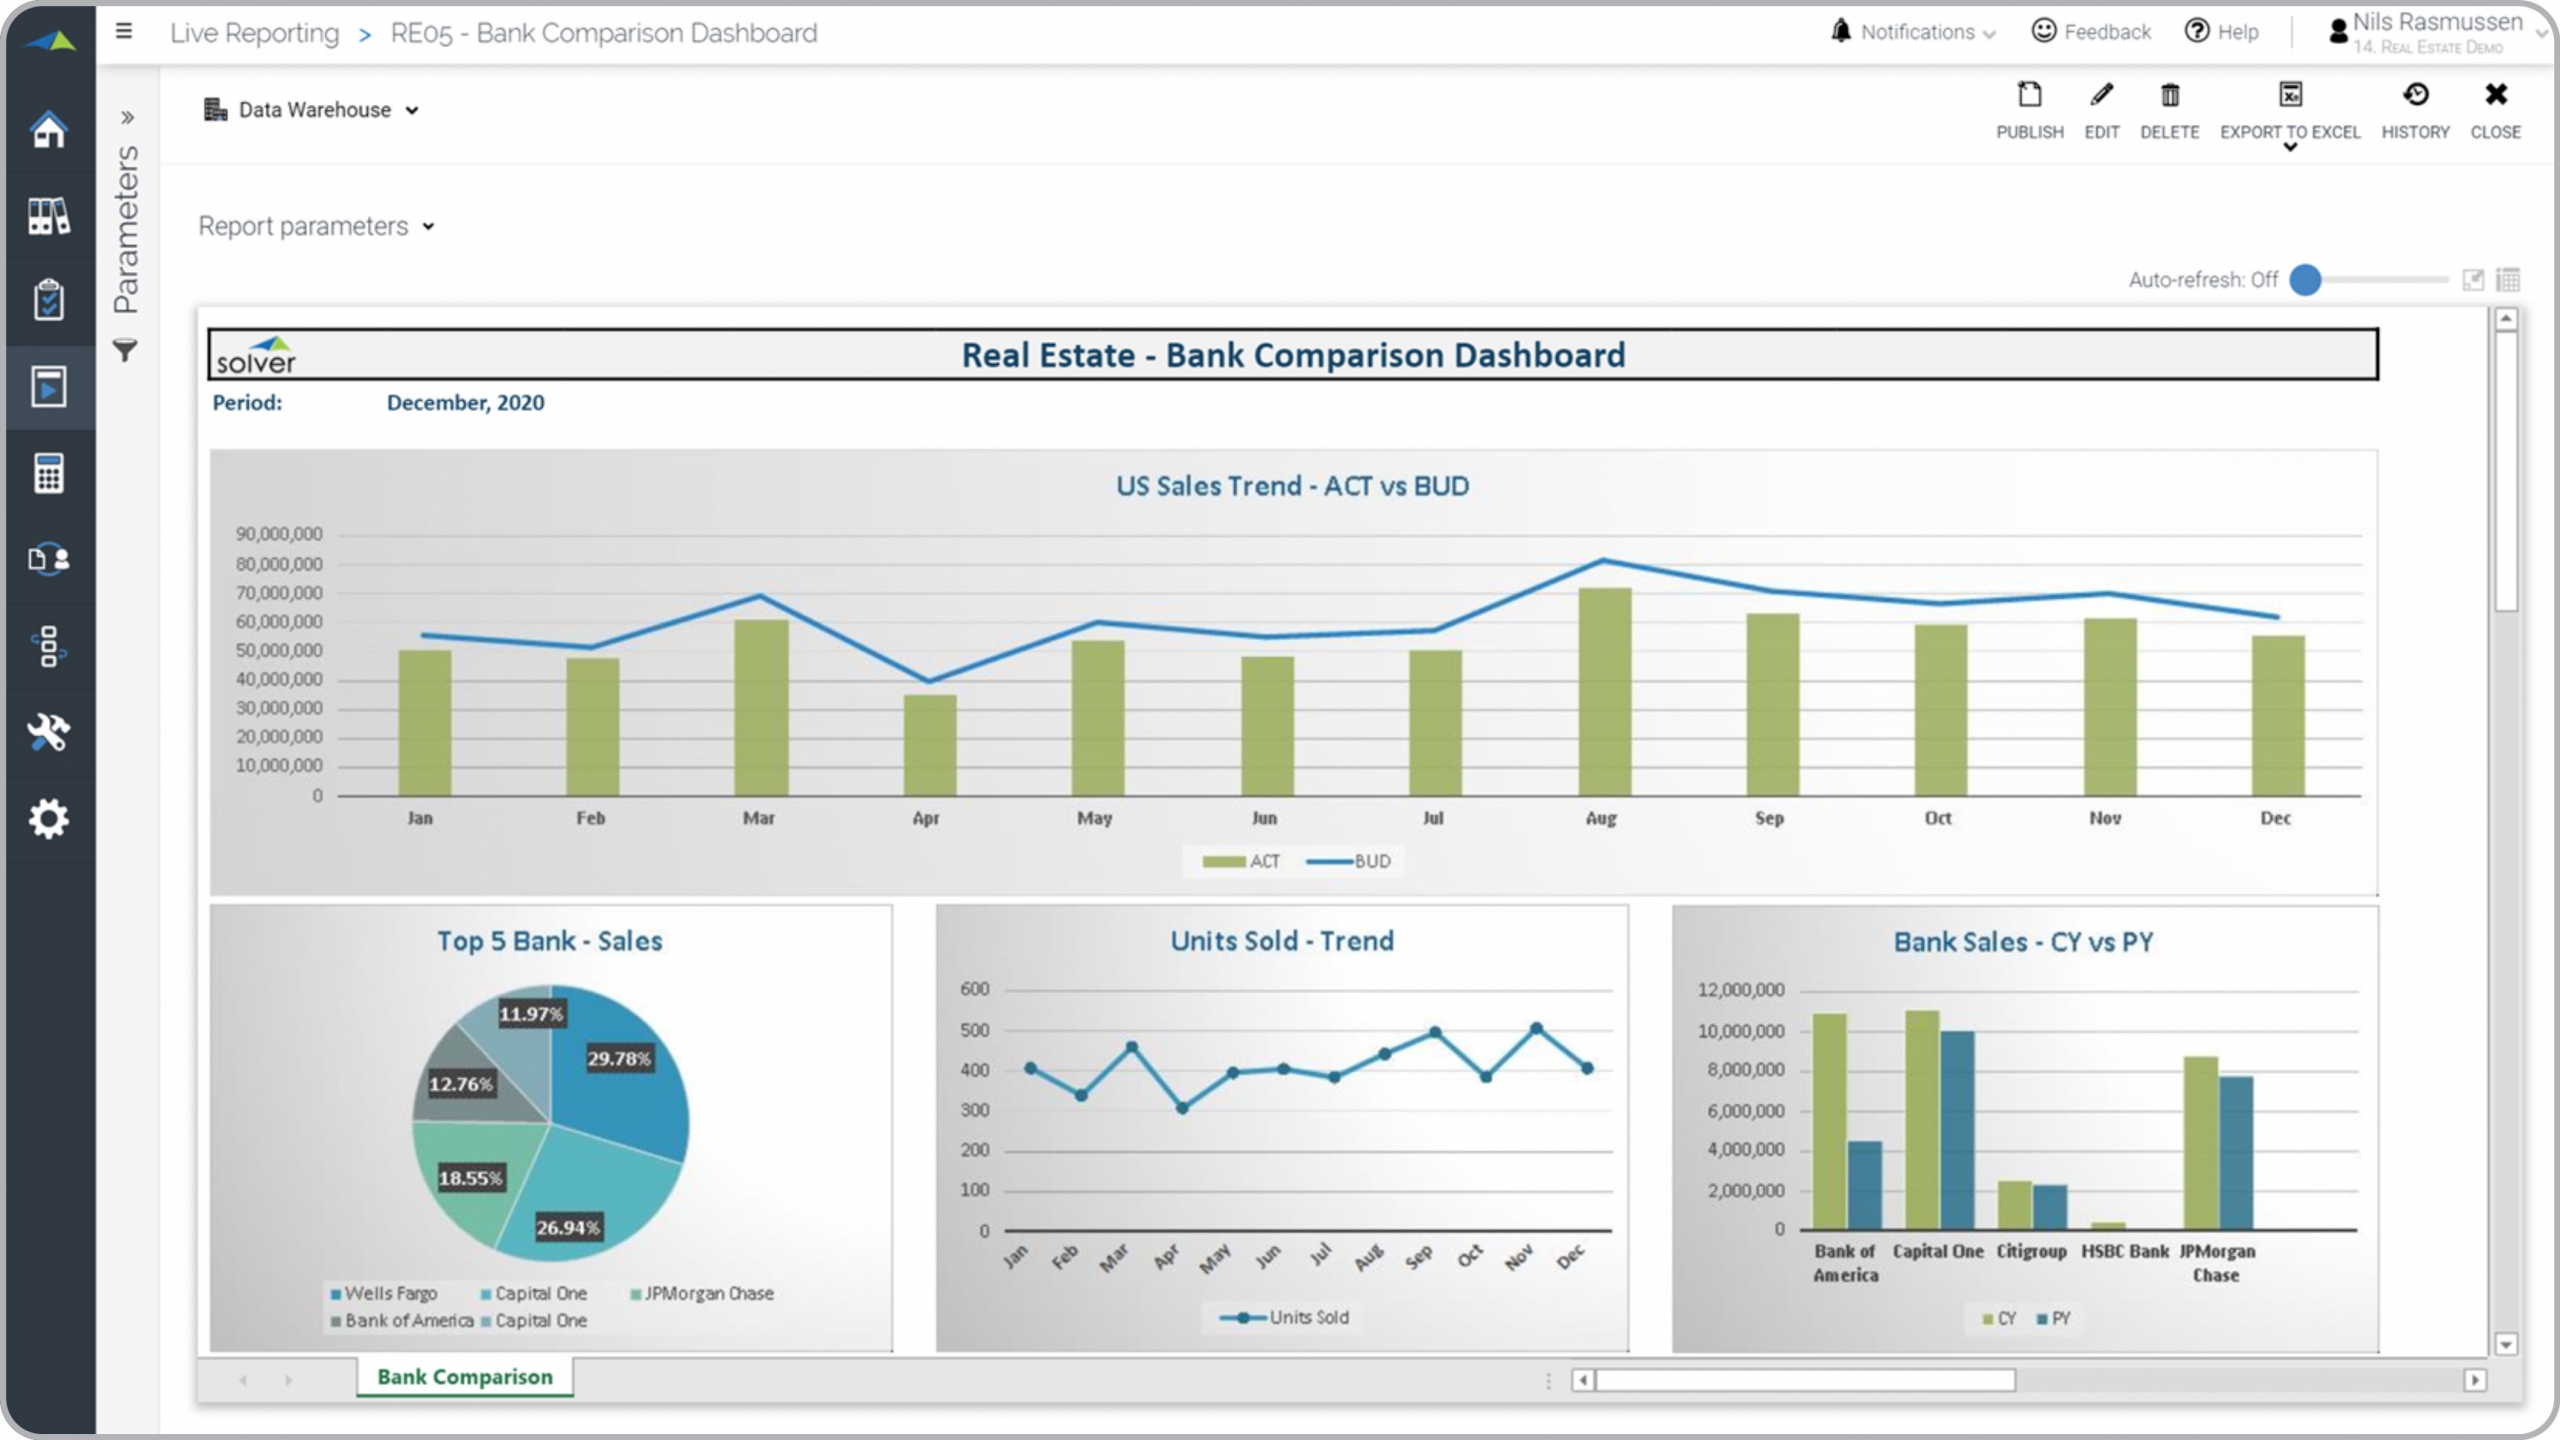 Example of a Bank Financing Dashboard for Real Estate Companies[/caption] You can find hundreds of additional examples
here
Who Uses This Type of
Dashboard
? The typical users of this type of dashboard are: Sales Executives, CFOs, budget managers and agents.
Other Reports Often Used in Conjunction with
Bank Financing Dashboards Progressive Sales and Financial Planning and Analysis (FP&A) departments sometimes use several different Bank Financing Dashboards, along with detailed sales reports, bank financing reports, KPI dashboards, financial statements, annual budget models, corporate forecasts and other management and control tools.
Where Does the Data for Analysis Originate From? The Actual (historical transactions) data typically comes from enterprise resource planning (ERP) systems like: Microsoft Dynamics 365 (D365) Finance, Microsoft Dynamics 365 Business Central (D365 BC), Microsoft Dynamics AX, Microsoft Dynamics NAV, Microsoft Dynamics GP, Microsoft Dynamics SL, Sage Intacct, Sage 100, Sage 300, Sage 500, Sage X3, SAP Business One, SAP ByDesign, Acumatica, Netsuite and others. In analyses where budgets or forecasts are used, the planning data most often originates from in-house Excel spreadsheet models or from professional corporate performance management (CPM/EPM) solutions.
What Tools are Typically used for Reporting, Planning and Dashboards? Examples of business software used with the data and ERPs mentioned above are:
Example of a Bank Financing Dashboard for Real Estate Companies[/caption] You can find hundreds of additional examples
here
Who Uses This Type of
Dashboard
? The typical users of this type of dashboard are: Sales Executives, CFOs, budget managers and agents.
Other Reports Often Used in Conjunction with
Bank Financing Dashboards Progressive Sales and Financial Planning and Analysis (FP&A) departments sometimes use several different Bank Financing Dashboards, along with detailed sales reports, bank financing reports, KPI dashboards, financial statements, annual budget models, corporate forecasts and other management and control tools.
Where Does the Data for Analysis Originate From? The Actual (historical transactions) data typically comes from enterprise resource planning (ERP) systems like: Microsoft Dynamics 365 (D365) Finance, Microsoft Dynamics 365 Business Central (D365 BC), Microsoft Dynamics AX, Microsoft Dynamics NAV, Microsoft Dynamics GP, Microsoft Dynamics SL, Sage Intacct, Sage 100, Sage 300, Sage 500, Sage X3, SAP Business One, SAP ByDesign, Acumatica, Netsuite and others. In analyses where budgets or forecasts are used, the planning data most often originates from in-house Excel spreadsheet models or from professional corporate performance management (CPM/EPM) solutions.
What Tools are Typically used for Reporting, Planning and Dashboards? Examples of business software used with the data and ERPs mentioned above are:
- Native ERP report writers and query tools
- Spreadsheets (for example Microsoft Excel)
- Corporate Performance Management (CPM) tools (for example Solver)
- Dashboards (for example Microsoft Power BI and Tableau)
- View 100’s of reporting, consolidations, planning, budgeting, forecasting and dashboard examples here
- View a Real Estate industry white paper and other industry-specific information here
- See how reports are designed in a modern report writer using a cloud-connected Excel add-in writer
- Discover how the Solver CPM solution delivers financial and operational reporting
- Discover how the Solver CPM solution delivers planning, budgeting and forecasting
- Watch demo videos of reporting, planning and dashboards
July 1, 2021
TAGS: Reporting, Solver, report writer, Microsoft, template, practice, Acumatica, Netsuite, Finance, comparison, planning, GP, dashboard, Business Central, excel, ax, forecast, Budget, Dynamics 365, budgeting, bank, Cloud, Software, Tableau, SAP, example, best, Sage, BC, D365, NAV, Intacct, Real Estate, CPM, report, SL, Management, dynamics, sales, Power BI, property development, bank financing