
What is a
Balance Sheet by Fund Report
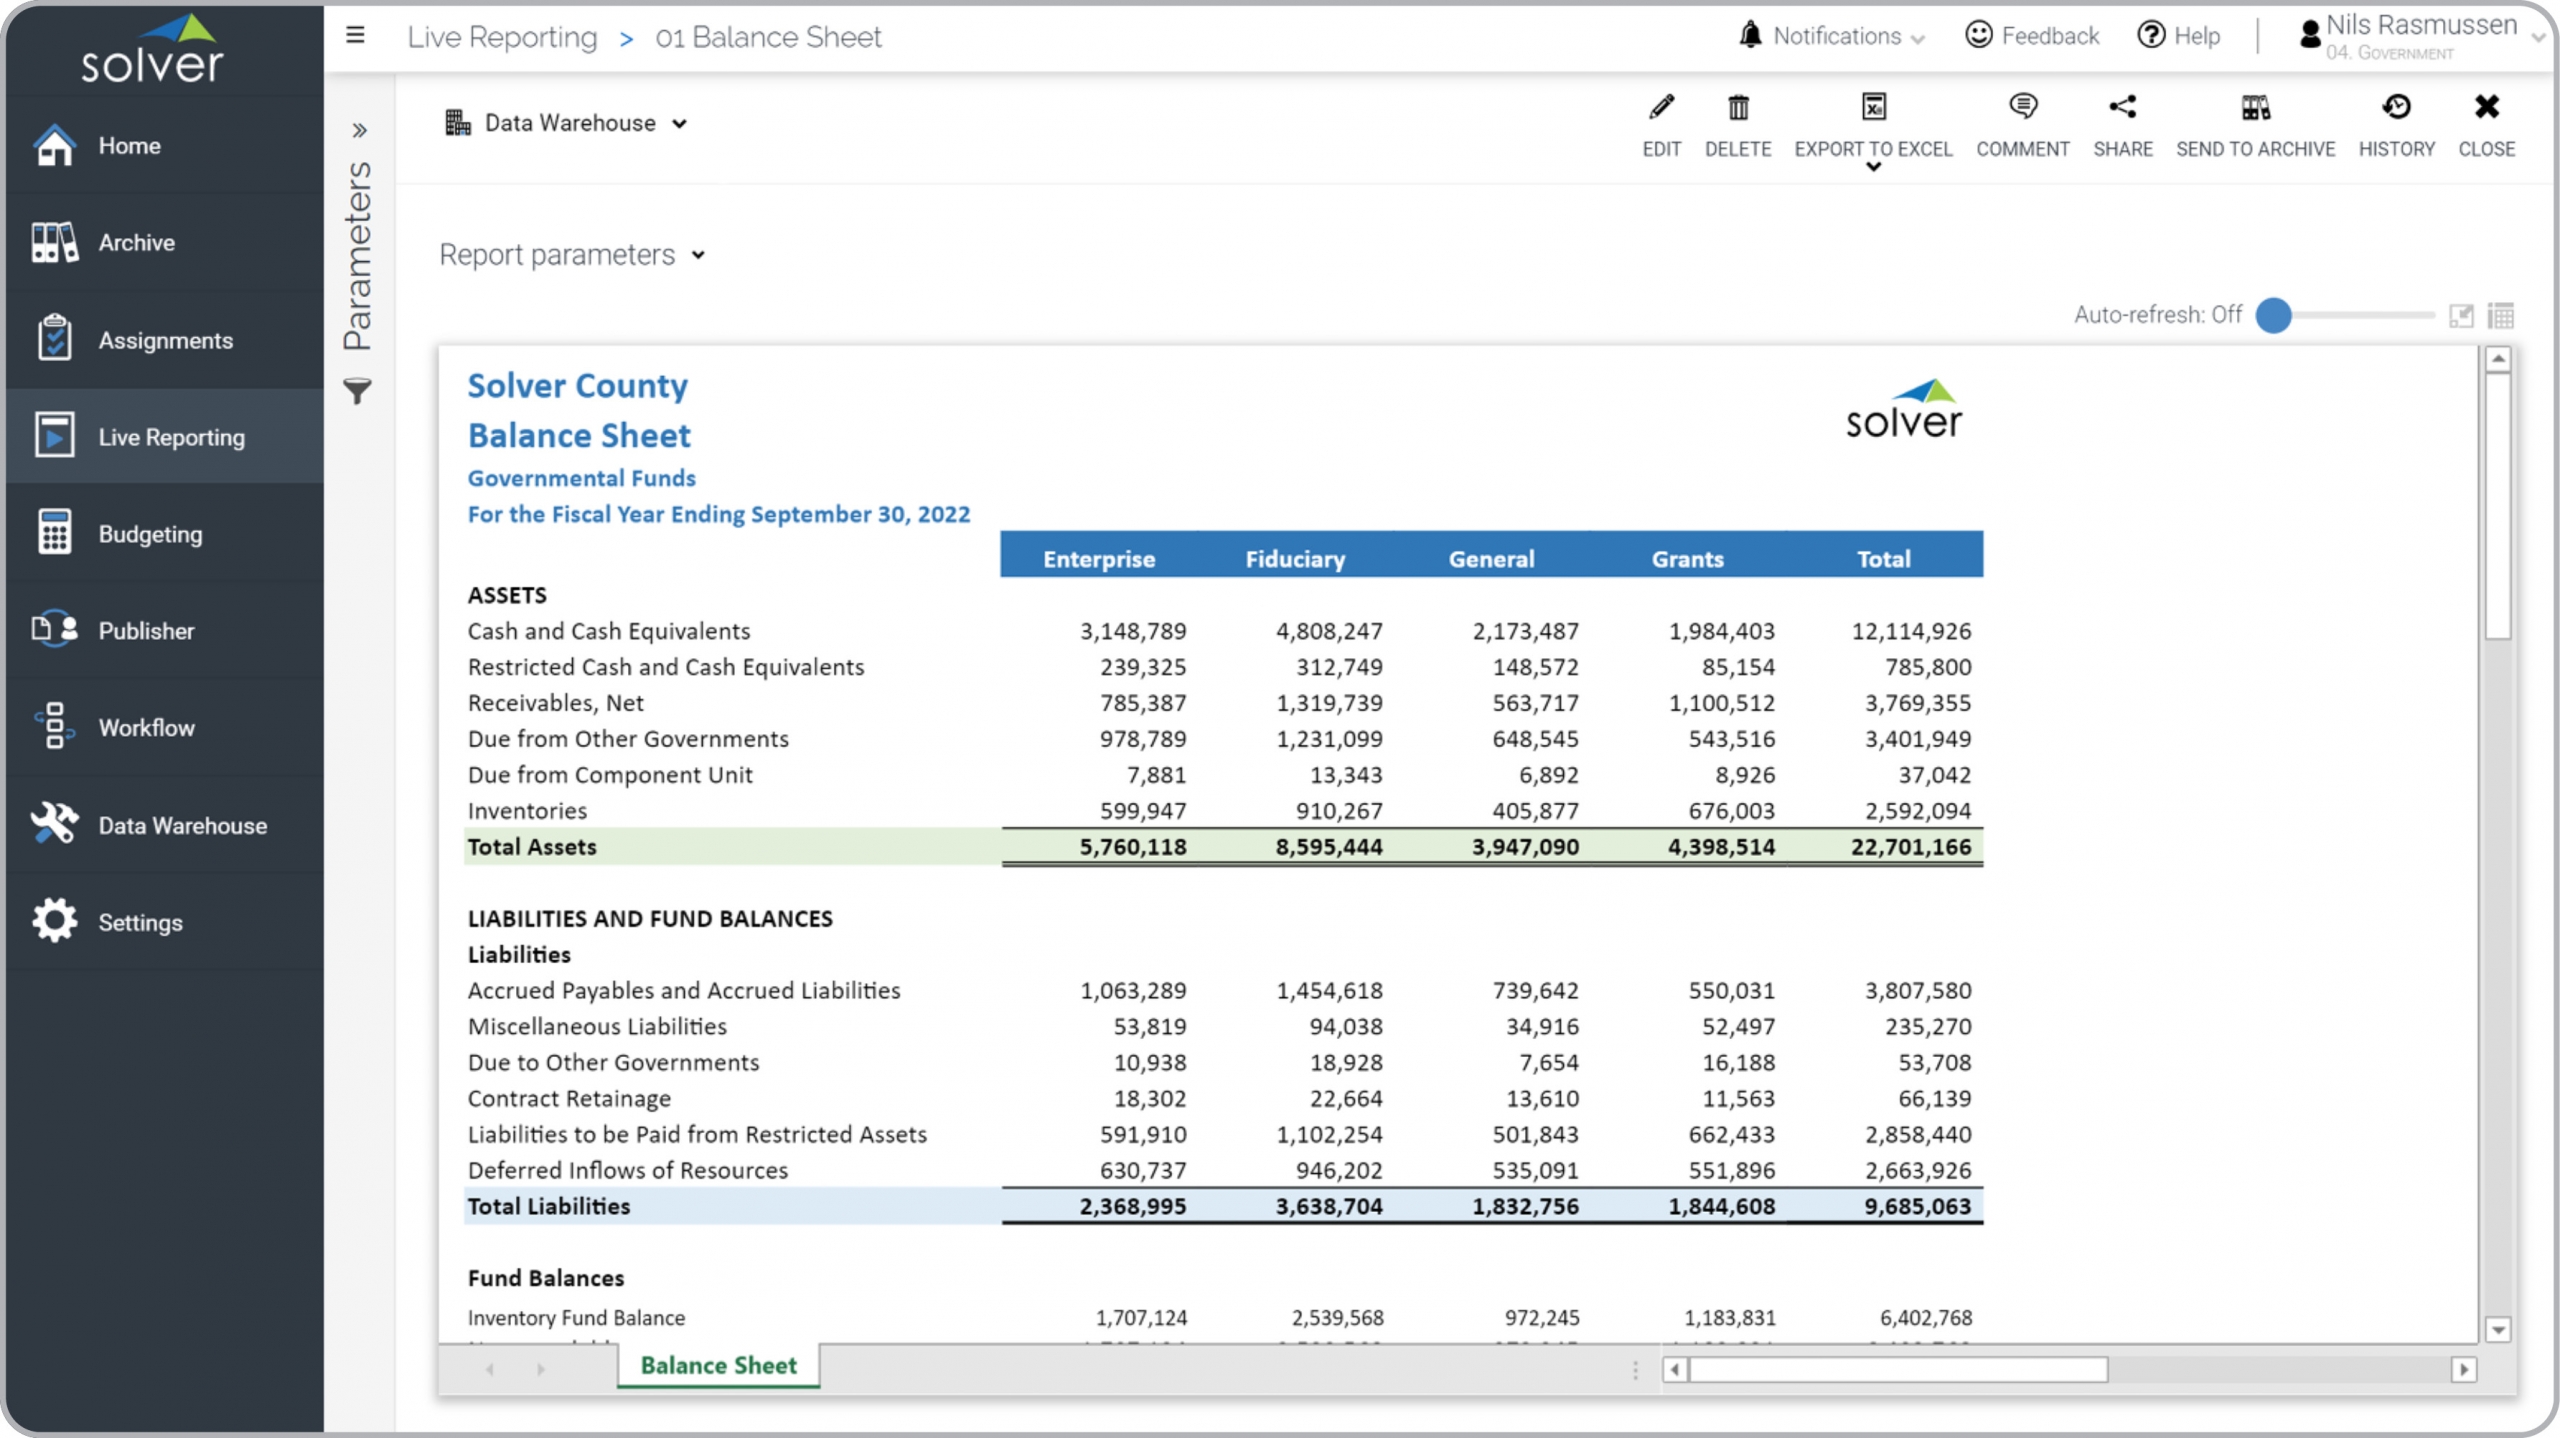
? Balance Sheet Reports that break out funds across columns are considered period end financial statements and are used by controllers and accountants to present funds in a side by side format. Some of the main functionality in this type of report is that it is filtered by the year/period parameter chosen by the user and both the rows and the columns are driven by dynamic ranges that automatically can include new accounts (object codes) or funds created during the year. This is often a problem with legacy reporting tools or manual spreadsheet models where users must remember to manually insert new items that were created in the ERP system. The report can also be set up to include charts and indicators. You find an example of this type of report below.
Purpose of
Balance Sheet by Fund Reports Public Sector organizations use Balance Sheet by Fund Reports both because it is often a required report format by the institution and to make it easy for managers and external users to review fund balances side-by-side. When used as part of good business practices in Accounting departments, a government entity can improve its monthly and annual report preparation process, and it can reduce the chances that comes with using static legacy reporting tools.
Example of a
Balance Sheet by Fund Report Here is an example of a Balance Sheet by Fund Report with Funds listed across the columns and a typical row layout. [caption id="" align="alignnone" width="2560"]
 Example of a Balance Sheet by Fund Report for Public Sector Organizations[/caption] You can find hundreds of additional examples
here
Who Uses This Type of
Report
? The typical users of this type of report are: CFOs, controllers, accountants, executives.
Other Reports Often Used in Conjunction with
Balance Sheet by Fund Reports Progressive Accounting departments sometimes use several different Balance Sheet by Fund Reports, along with cash flow statements, sources and uses of funds, fund detail reports, trial balances, KPI reports and other management and control tools.
Where Does the Data for Analysis Originate From? The Actual (historical transactions) data typically comes from enterprise resource planning (ERP) systems like: Microsoft Dynamics 365 (D365) Finance, Microsoft Dynamics 365 Business Central (D365 BC), Microsoft Dynamics AX, Microsoft Dynamics NAV, Microsoft Dynamics GP, Microsoft Dynamics SL, Sage Intacct, Sage 100, Sage 300, Sage 500, Sage X3, SAP Business One, SAP ByDesign, Acumatica, Netsuite and others. In analyses where budgets or forecasts are used, the planning data most often originates from in-house Excel spreadsheet models or from professional corporate performance management (CPM/EPM) solutions.
What Tools are Typically used for Reporting, Planning and Dashboards? Examples of business software used with the data and ERPs mentioned above are:
Example of a Balance Sheet by Fund Report for Public Sector Organizations[/caption] You can find hundreds of additional examples
here
Who Uses This Type of
Report
? The typical users of this type of report are: CFOs, controllers, accountants, executives.
Other Reports Often Used in Conjunction with
Balance Sheet by Fund Reports Progressive Accounting departments sometimes use several different Balance Sheet by Fund Reports, along with cash flow statements, sources and uses of funds, fund detail reports, trial balances, KPI reports and other management and control tools.
Where Does the Data for Analysis Originate From? The Actual (historical transactions) data typically comes from enterprise resource planning (ERP) systems like: Microsoft Dynamics 365 (D365) Finance, Microsoft Dynamics 365 Business Central (D365 BC), Microsoft Dynamics AX, Microsoft Dynamics NAV, Microsoft Dynamics GP, Microsoft Dynamics SL, Sage Intacct, Sage 100, Sage 300, Sage 500, Sage X3, SAP Business One, SAP ByDesign, Acumatica, Netsuite and others. In analyses where budgets or forecasts are used, the planning data most often originates from in-house Excel spreadsheet models or from professional corporate performance management (CPM/EPM) solutions.
What Tools are Typically used for Reporting, Planning and Dashboards? Examples of business software used with the data and ERPs mentioned above are:
- Native ERP report writers and query tools
- Spreadsheets (for example Microsoft Excel)
- Corporate Performance Management (CPM) tools (for example Solver)
- Dashboards (for example Microsoft Power BI and Tableau)
- View 100’s of reporting, consolidations, planning, budgeting, forecasting and dashboard examples here
- View a Public Sector white paper and other industry-specific information here
- See how reports are designed in a modern report writer using a cloud-connected Excel add-in writer
- Discover how the Solver CPM solution delivers financial and operational reporting
- Discover how the Solver CPM solution delivers planning, budgeting and forecasting
- Watch demo videos of reporting, planning and dashboards
July 5, 2021
TAGS: Reporting, Solver, local, report writer, Microsoft, template, practice, Acumatica, Netsuite, Finance, public, planning, GP, Government, Business Central, state, excel, ax, forecast, Budget, Dynamics 365, budgeting, Cloud, Software, Tableau, SAP, example, best, Sage, BC, D365, fund, NAV, Intacct, county, city, Balance Sheet, CPM, report, sector, SL, Management, dynamics, Power BI, consolidating fund report, reporting package, balance sheet by fund