
Sports – Merchandise Sales
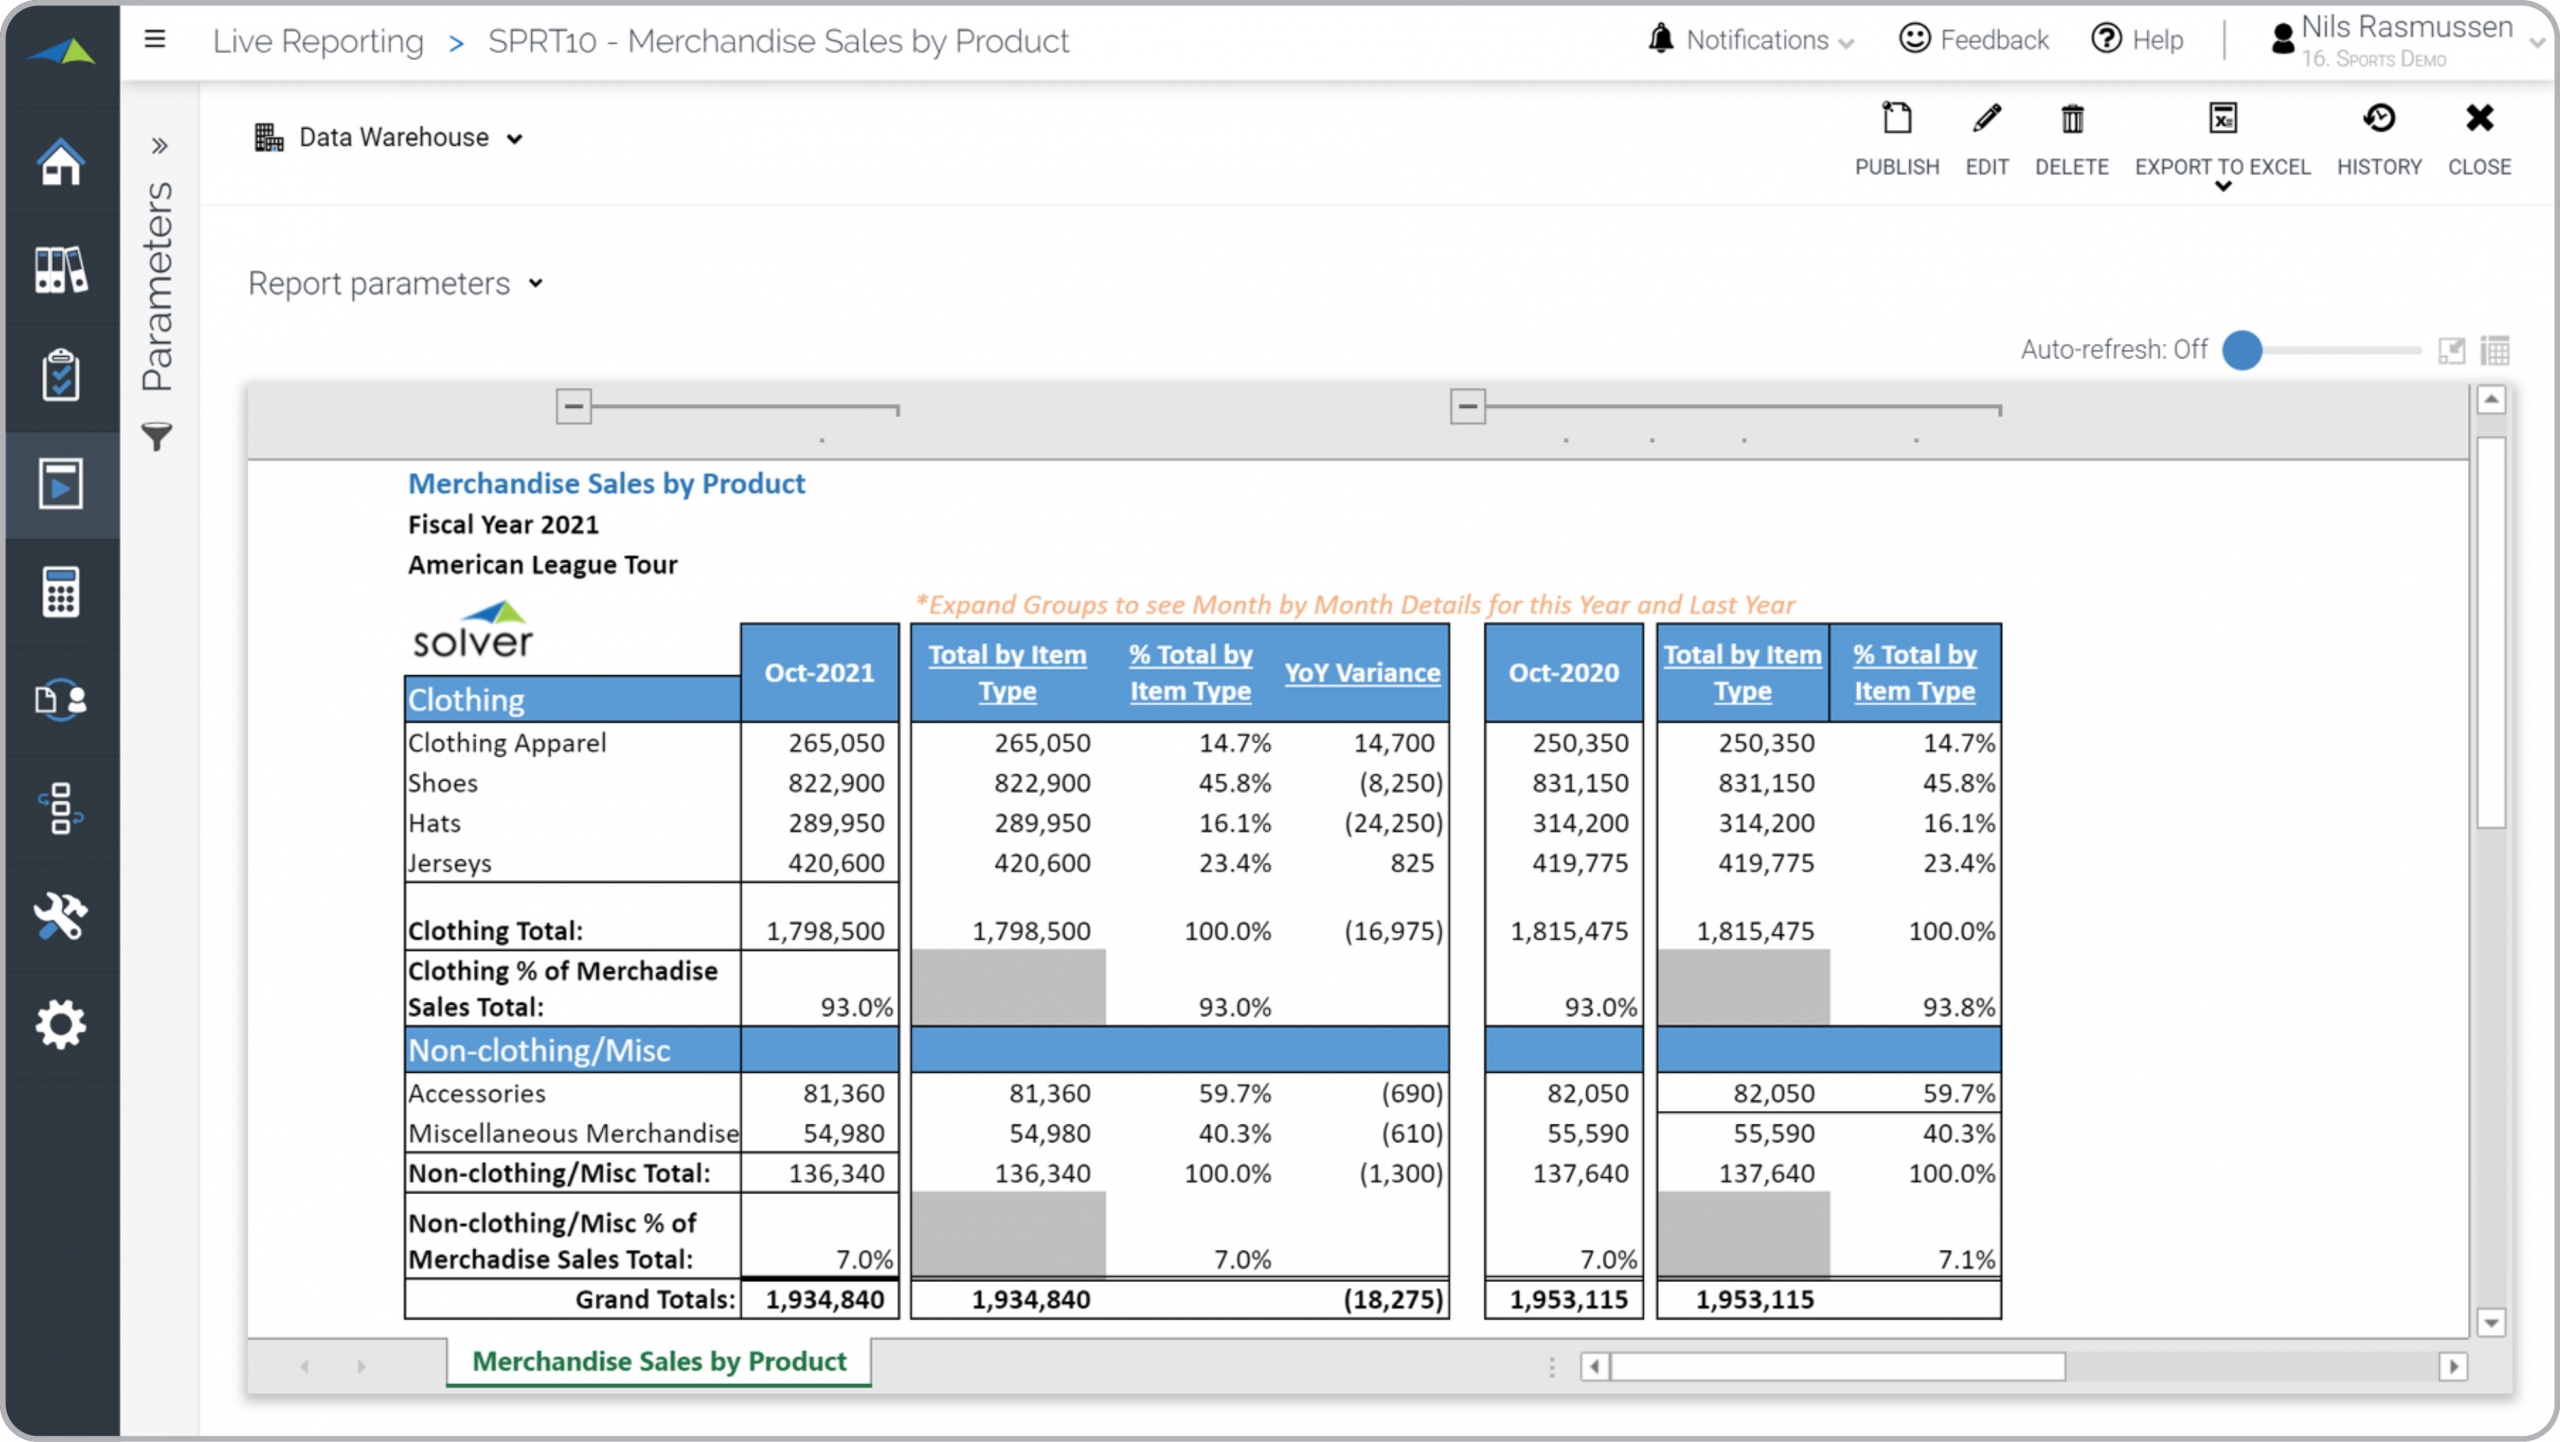
What is a Merchandise Sales Variance Report? Merchandise Sales Variance Reports are considered product sales analysis tools and are used by sales and merchandise managers to monitor variances in sales compared to the same month in the prior year. Some of the main functionality in this type of report is that it shows columns with sales and percent variance for the current month compared to the same period in the prior year. The rows show different product categories grouped and sub-totaled by clothing and non-clothing items. You find an example of this type of report below.
Purpose of Product Sales Reports Sports organizations use Product Sales Reports to easily analyze the sales performance of different merchandise items. When used as part of good business practices in Sales and FP&A departments, an organization can improve its product strategies and increase revenues, and it can reduce the chances that excessive inventory builds up (or the opposite) due to poor visibility into product sales trends.
Who Uses This Type of Report? The typical users of this type of report are: product managers, merchandise managers, buyers, sales managers, store managers. Other Reports Often Used in Conjunction with Product Sales Reports Progressive Sales and FP&A departments sometimes use several different Product Sales Reports, along with detailed product sales reports, sales forecasts, sales by store reports, profit & loss reports and other management and control tools.
Where Does the Data for Analysis Originate From? The Actual (historical transactions) data typically comes from enterprise resource planning (ERP) systems. In analyses where budgets or forecasts are used, the planning data most often originates from in-house Excel spreadsheet models or from professional xFP&A solutions.
Built for sports finance teams and aligned with Solver's xFP&A platform, this Solver report template connects directly to your ERP data via the Solver Data Warehouse, enabling near real-time analysis with minimal setup. Designed for QuickStart deployment, it can be activated rapidly so your team can focus on analysis and decisions — not data preparation.
What is the Sports – Merchandise Sales in Solver? The Sports – Merchandise Sales is a pre-built xFP&A report template in Solver designed for sports organizations. It delivers key financial and operational metrics in a single, easy-to-use interface — purpose-built for sports finance workflows.
Who uses this Solver report template? Cfos, finance managers, and sports organization executives in sports organizations rely on this Solver report template to replace manual spreadsheet-based processes with automated, near real-time analysis. It is especially useful during month-end close, budget cycles, and board reporting.
Where does the data come from? Data is sourced automatically from your ERP system through the Solver Data Warehouse. Point-of-sale, ticketing, and broadcasting revenue systems can also be connected for a complete event and venue revenue picture. Once connected, the template updates in near real-time with no manual data entry required.
To learn more, visit the Resource Library.