
Healthcare – Patient Satisfaction Dashboard
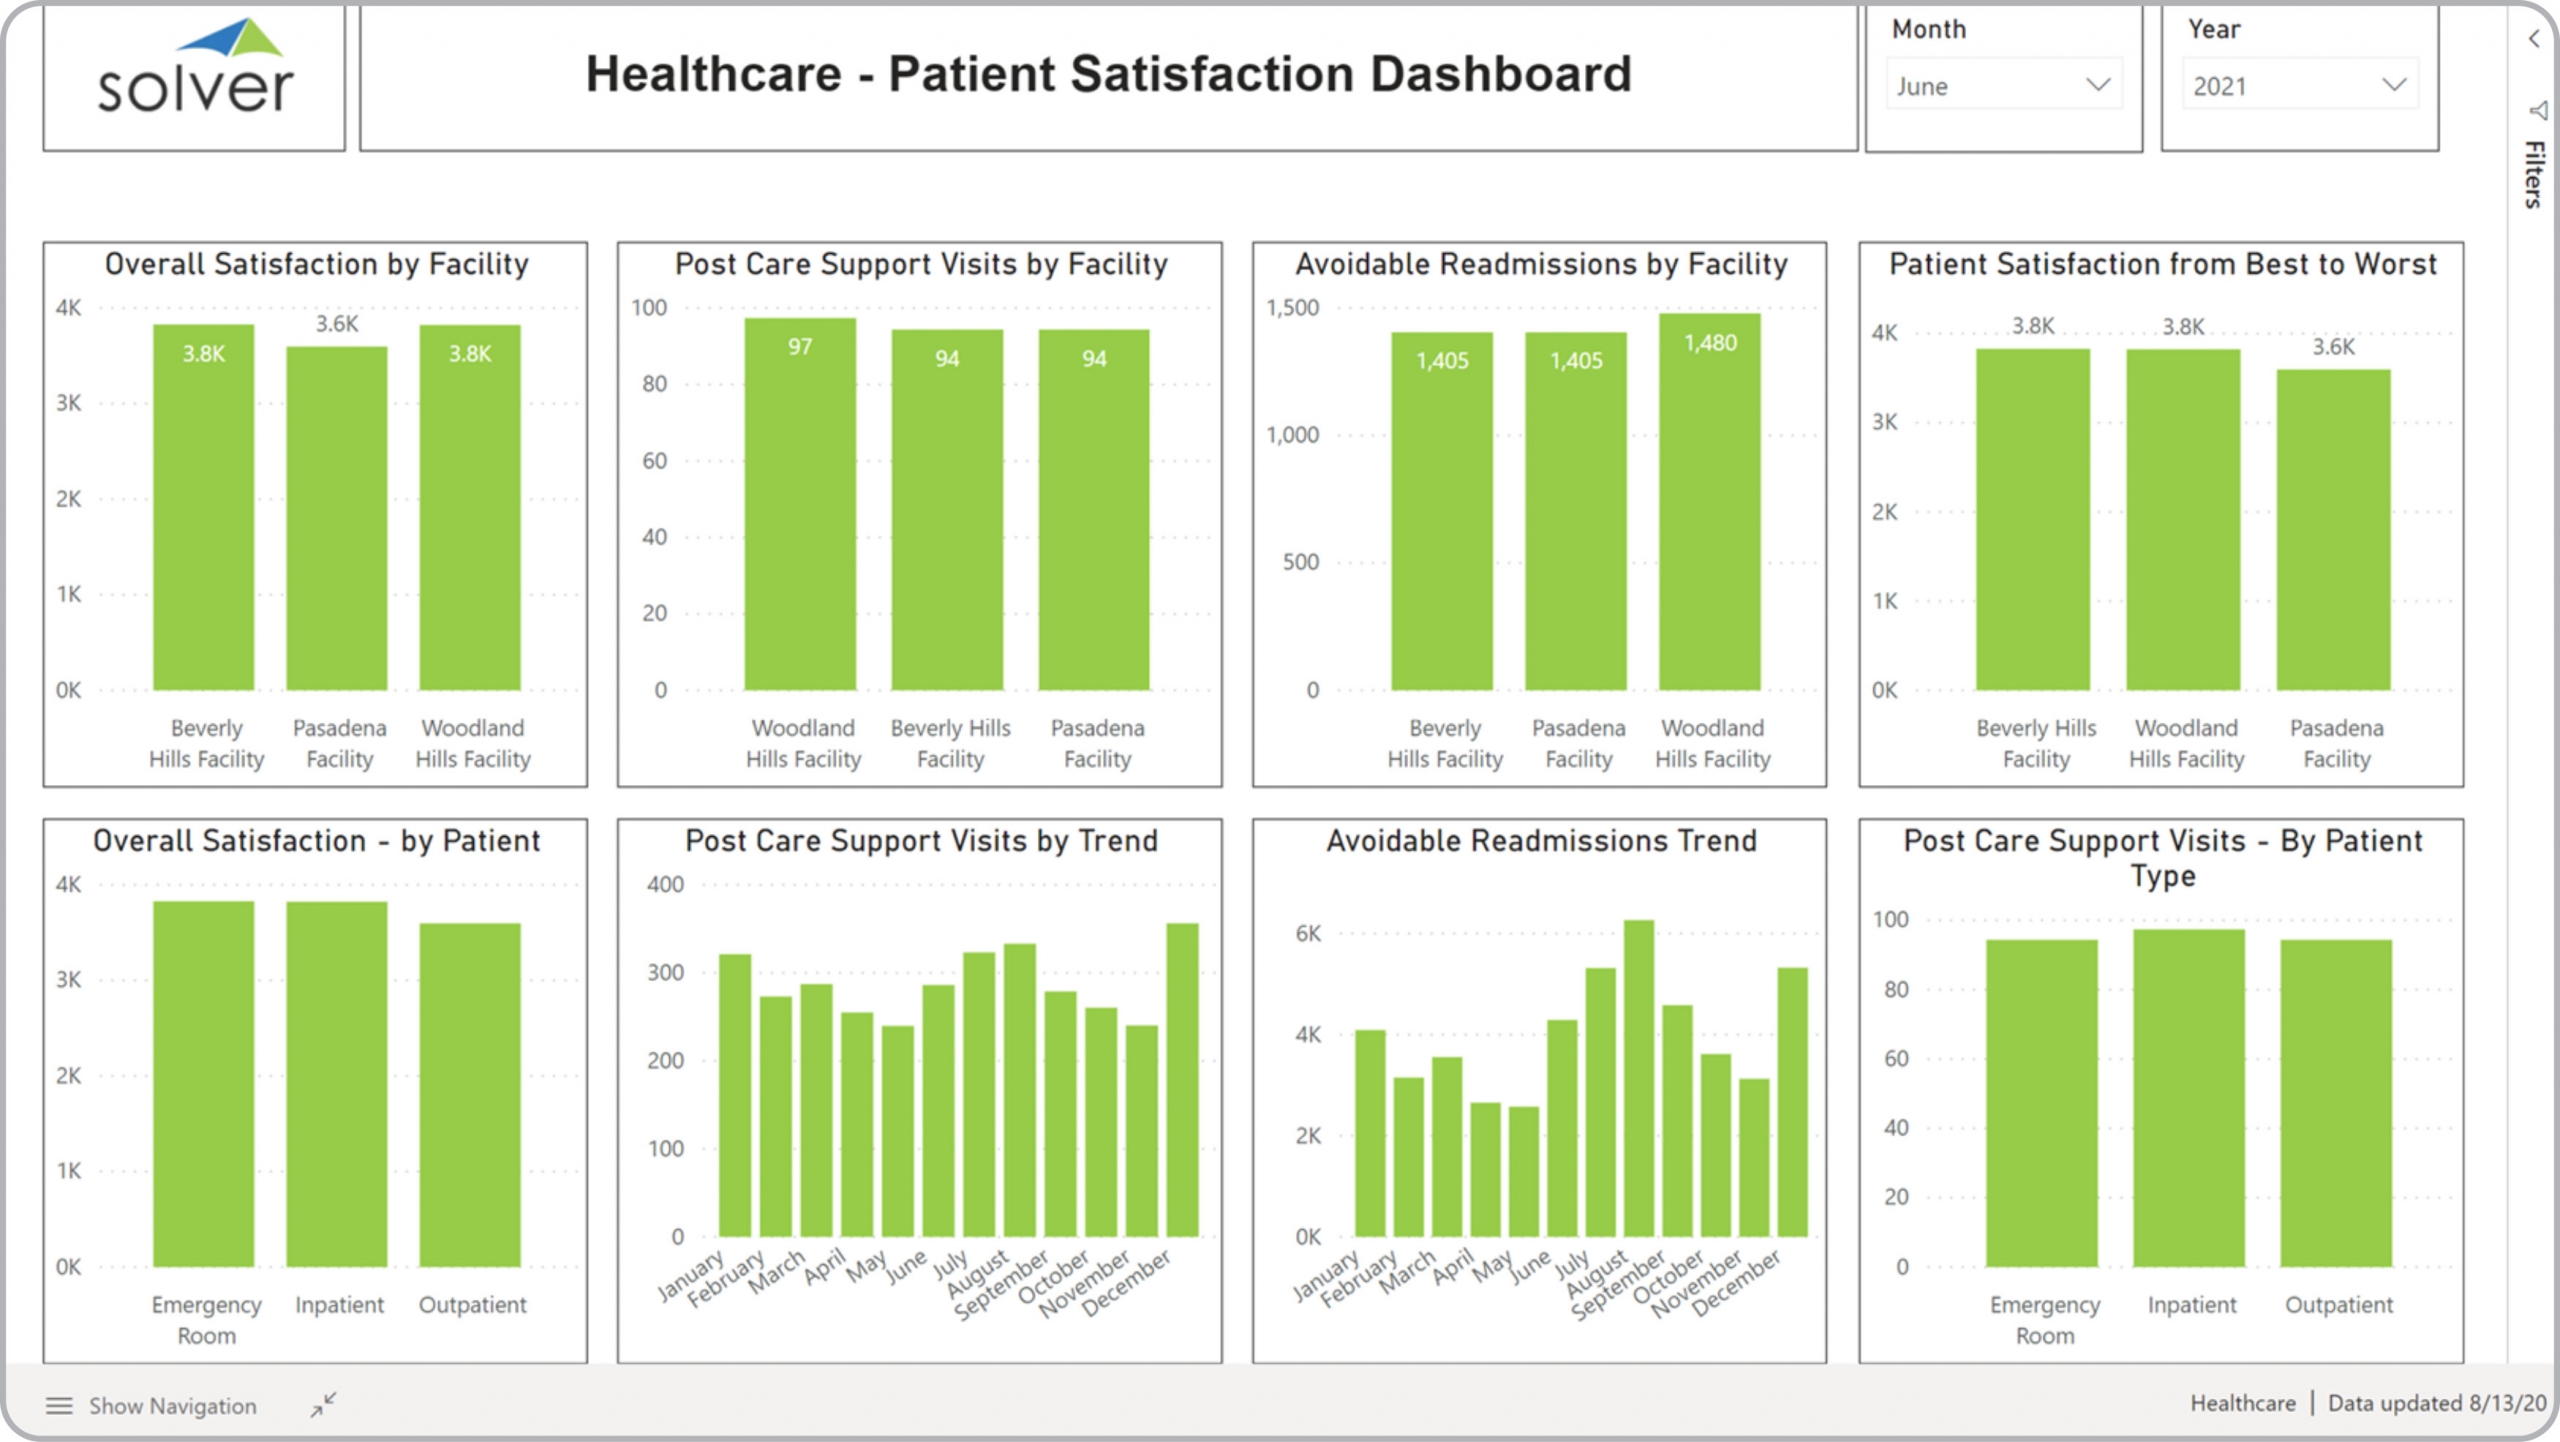
What is a Patient Satisfaction Dashboard? Patient Satisfaction Dashboards are considered operational analysis tools and are used by hospital executives to analyze the results of patient experience surveys and other patient metrics. Some of the main functionality in this type of dashboard is that it provides analysis from these eight perspectives: 1) Overall satisfaction by facility, 2) Post care support visits by facility, 3) Avoidable readmissions by facility, 4) Patient satisfaction from best to worst, 5) Overall satisfaction by patient, 6) Monthly trend in post care support visits, 7) Monthly trend in avoidable readmissions, and 8) Post care support visits by patient type You find an example of this type of dashboard below.
Purpose of Patient Satisfaction Dashboards Healthcare organizations use Patient Satisfaction Dashboards to monitor feedback on patient experience and to benchmark satisfaction metrics across facilities. When used as part of good business practices in executive departments, an organization can improve its recurring patient revenues and referrals, and it can reduce the chances that of a poor reputation and potential litigations.
Who Uses This Type of Dashboard? The typical users of this type of dashboard are: Chief physician, CEOs, CFOs, management. Other Reports Often Used in Conjunction with Patient Satisfaction Dashboards Progressive executive departments sometimes use several different Patient Satisfaction Dashboards, along with financial statements, claims reports, hospital KPI dashboards, executive dashboards, complaint reports and other management and control tools.
Where Does the Data for Analysis Originate From? The Actual (historical transactions) data typically comes from patient systems, survey tools and enterprise resource planning (ERP) systems. In analyses where budgets or forecasts are used, the planning data most often originates from in-house Excel spreadsheet models or from professional xFP&A solutions.
Built for healthcare finance teams and aligned with Solver's xFP&A platform, this Solver dashboard template connects directly to your ERP data via the Solver Data Warehouse, enabling near real-time analysis with minimal setup. Designed for QuickStart deployment, it can be activated rapidly so your team can focus on analysis and decisions — not data preparation.
What is the Healthcare – Patient Satisfaction Dashboard in Solver? The Healthcare – Patient Satisfaction Dashboard is a pre-built xFP&A dashboard template in Solver designed for healthcare organizations. It delivers key financial and operational metrics in a single, easy-to-use interface — purpose-built for healthcare finance workflows.
Who uses this Solver dashboard template? Finance leaders at healthcare organizations — including CFOs, healthcare finance managers, and controllers — use this template to get fast, reliable answers without waiting on IT or building custom reports. It supports both day-to-day monitoring and strategic decision-making.
Where does the data come from? Data is sourced automatically from your ERP system through the Solver Data Warehouse. Clinical and revenue cycle management systems can also be integrated for a complete financial and operational picture. Once connected, the template updates in near real-time with no manual data entry required.
To learn more, visit the Resource Library.