
Customer List and Count by Industry
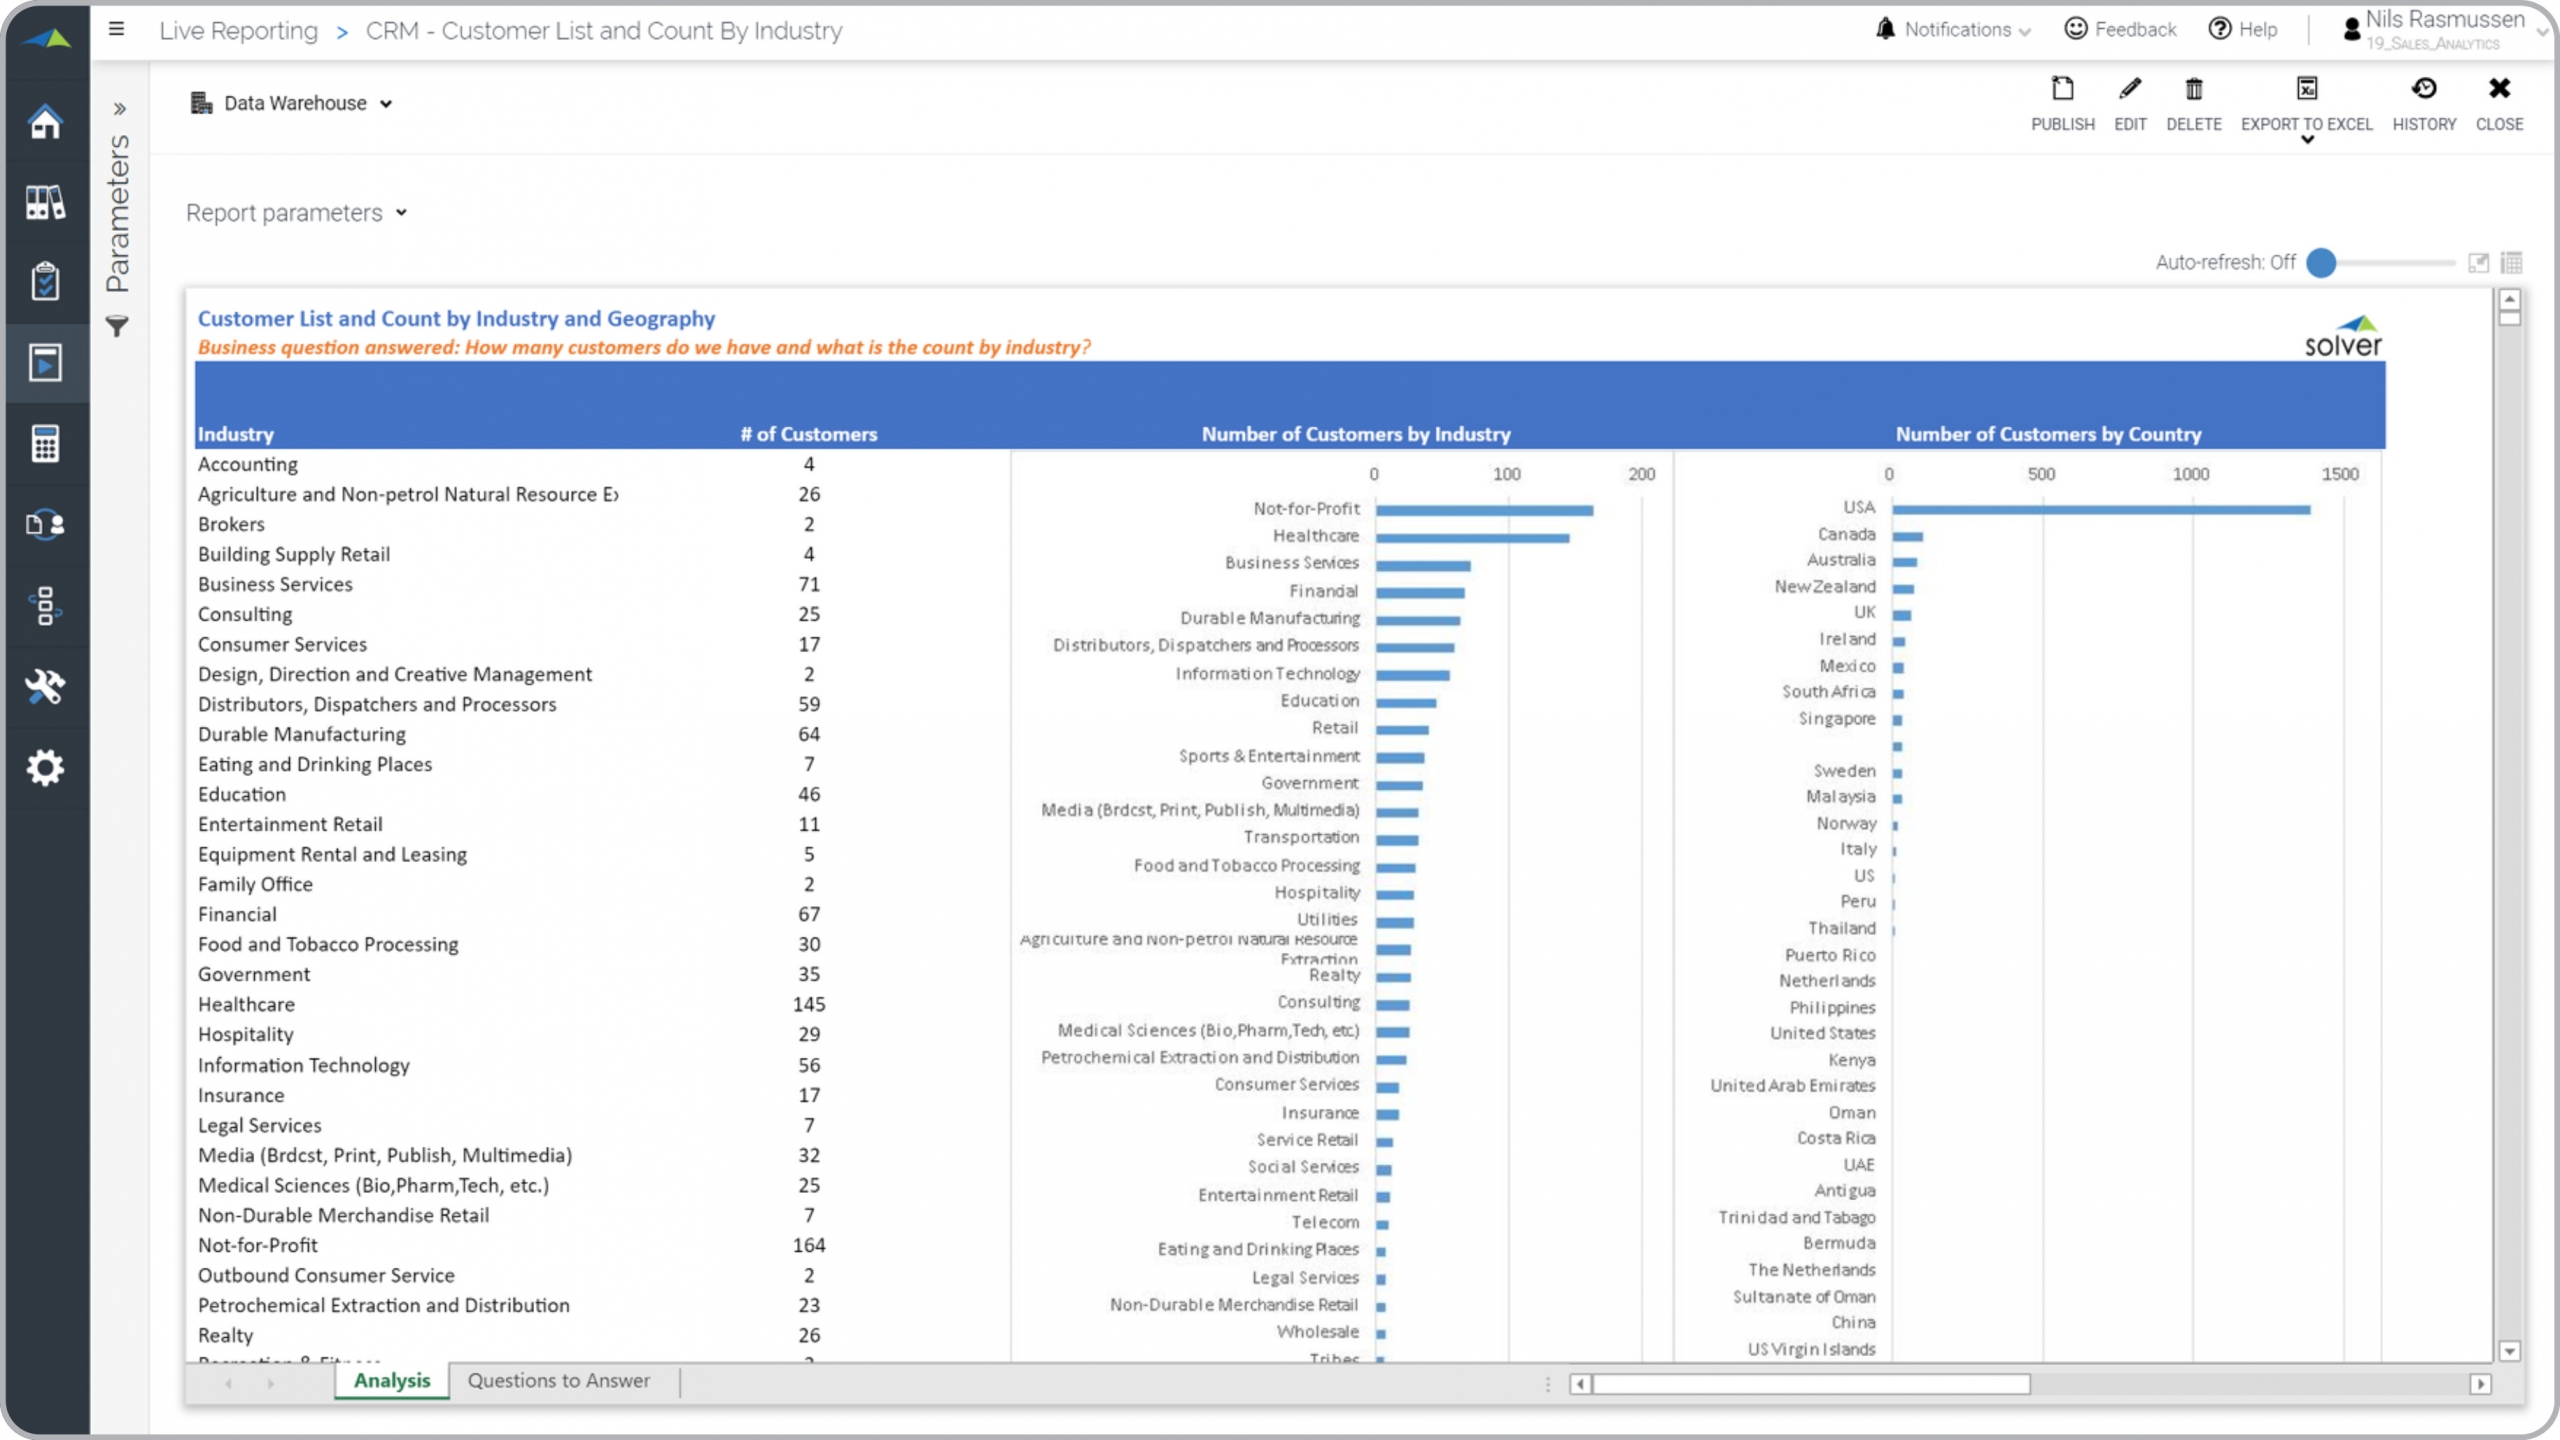
What is a Customer Segmentation and Analysis Report? Customer segmentation reports are considered essential tactical analysis tools and are often used by managers to optimize products, services, sales and marketing strategies. Some of the key functionality in this type of dashboard report is that it simplifies analysis by combining charts with metrics. The top of the report shows customer count by industry both as figures and as a ranked chart. The second visualization shows a ranked list of countries where customers are located. The bottom of the report (not visible in the screenshot below) lists all the individual transactions for use in drill-down analysis. The report can be filtered by parameters such as customer type and date range. You find an example of this type of dashboard report below.
Purpose of Customer Segmentation Analysis Reports Companies and organizations use customer segmentation analysis reports to optimize the corporate decisions that is derived from deep customer analysis. When used as part of good business practices, a company can improve its competitiveness as well as reduce the chances that important decisions are not grounded in a deep understanding of existing customer segmentation.
Who Uses This Type of Dashboard report? The typical users of this type of dashboard report are: Product and R&D managers, sales managers, marketing managers. Other Dashboard reports Often Used in Conjunction with Customer segmentation analysis reports Progressive management teams sometimes use several different customer segmentation analysis reports, along with customer dashboards, sales reports, financial statements and other management and control tools.
Where Does the Data for Analysis Originate From? The Actual (historical transactions) data typically comes from enterprise resource planning (ERP) systems like: Microsoft Dynamics 365 (D365) Finance, Microsoft Dynamics 365 Business Central (D365 BC), Microsoft Dynamics AX, Microsoft Dynamics NAV, Microsoft Dynamics GP, Microsoft Dynamics SL, Sage Intacct, Sage 100, Sage 300, Sage 500, Sage X3, SAP Business One, SAP ByDesign, Acumatica, Netsuite and others. In analyses where budgets or forecasts are used, the planning data most often originates from in-house Excel spreadsheet models or from professional xFP&A solutions.
This Solver report template connects directly to your ERP data via the Solver Data Warehouse, enabling near real-time analysis with minimal setup. Designed for QuickStart deployment, it can be activated rapidly so your team can focus on analysis and decisions — not data preparation.
What is the Customer List and Count by Industry in Solver? The Customer List and Count by Industry is a pre-built xFP&A report template in Solver that delivers key financial and operational metrics in a single, easy-to-use interface, eliminating the need for manual data work or custom report development.
Who uses this Solver report template? CFOs, FP&A managers, and controllers use this report template to support month-end close, variance analysis, and management reporting. It is designed to be self-service and require no custom development.
Where does the data come from? Data is sourced automatically from your ERP system through the Solver Data Warehouse. Once connected, the template updates in near real-time with no manual data entry required.
To learn more, visit the Resource Library.