
Bank – Loan Performance Dashboard
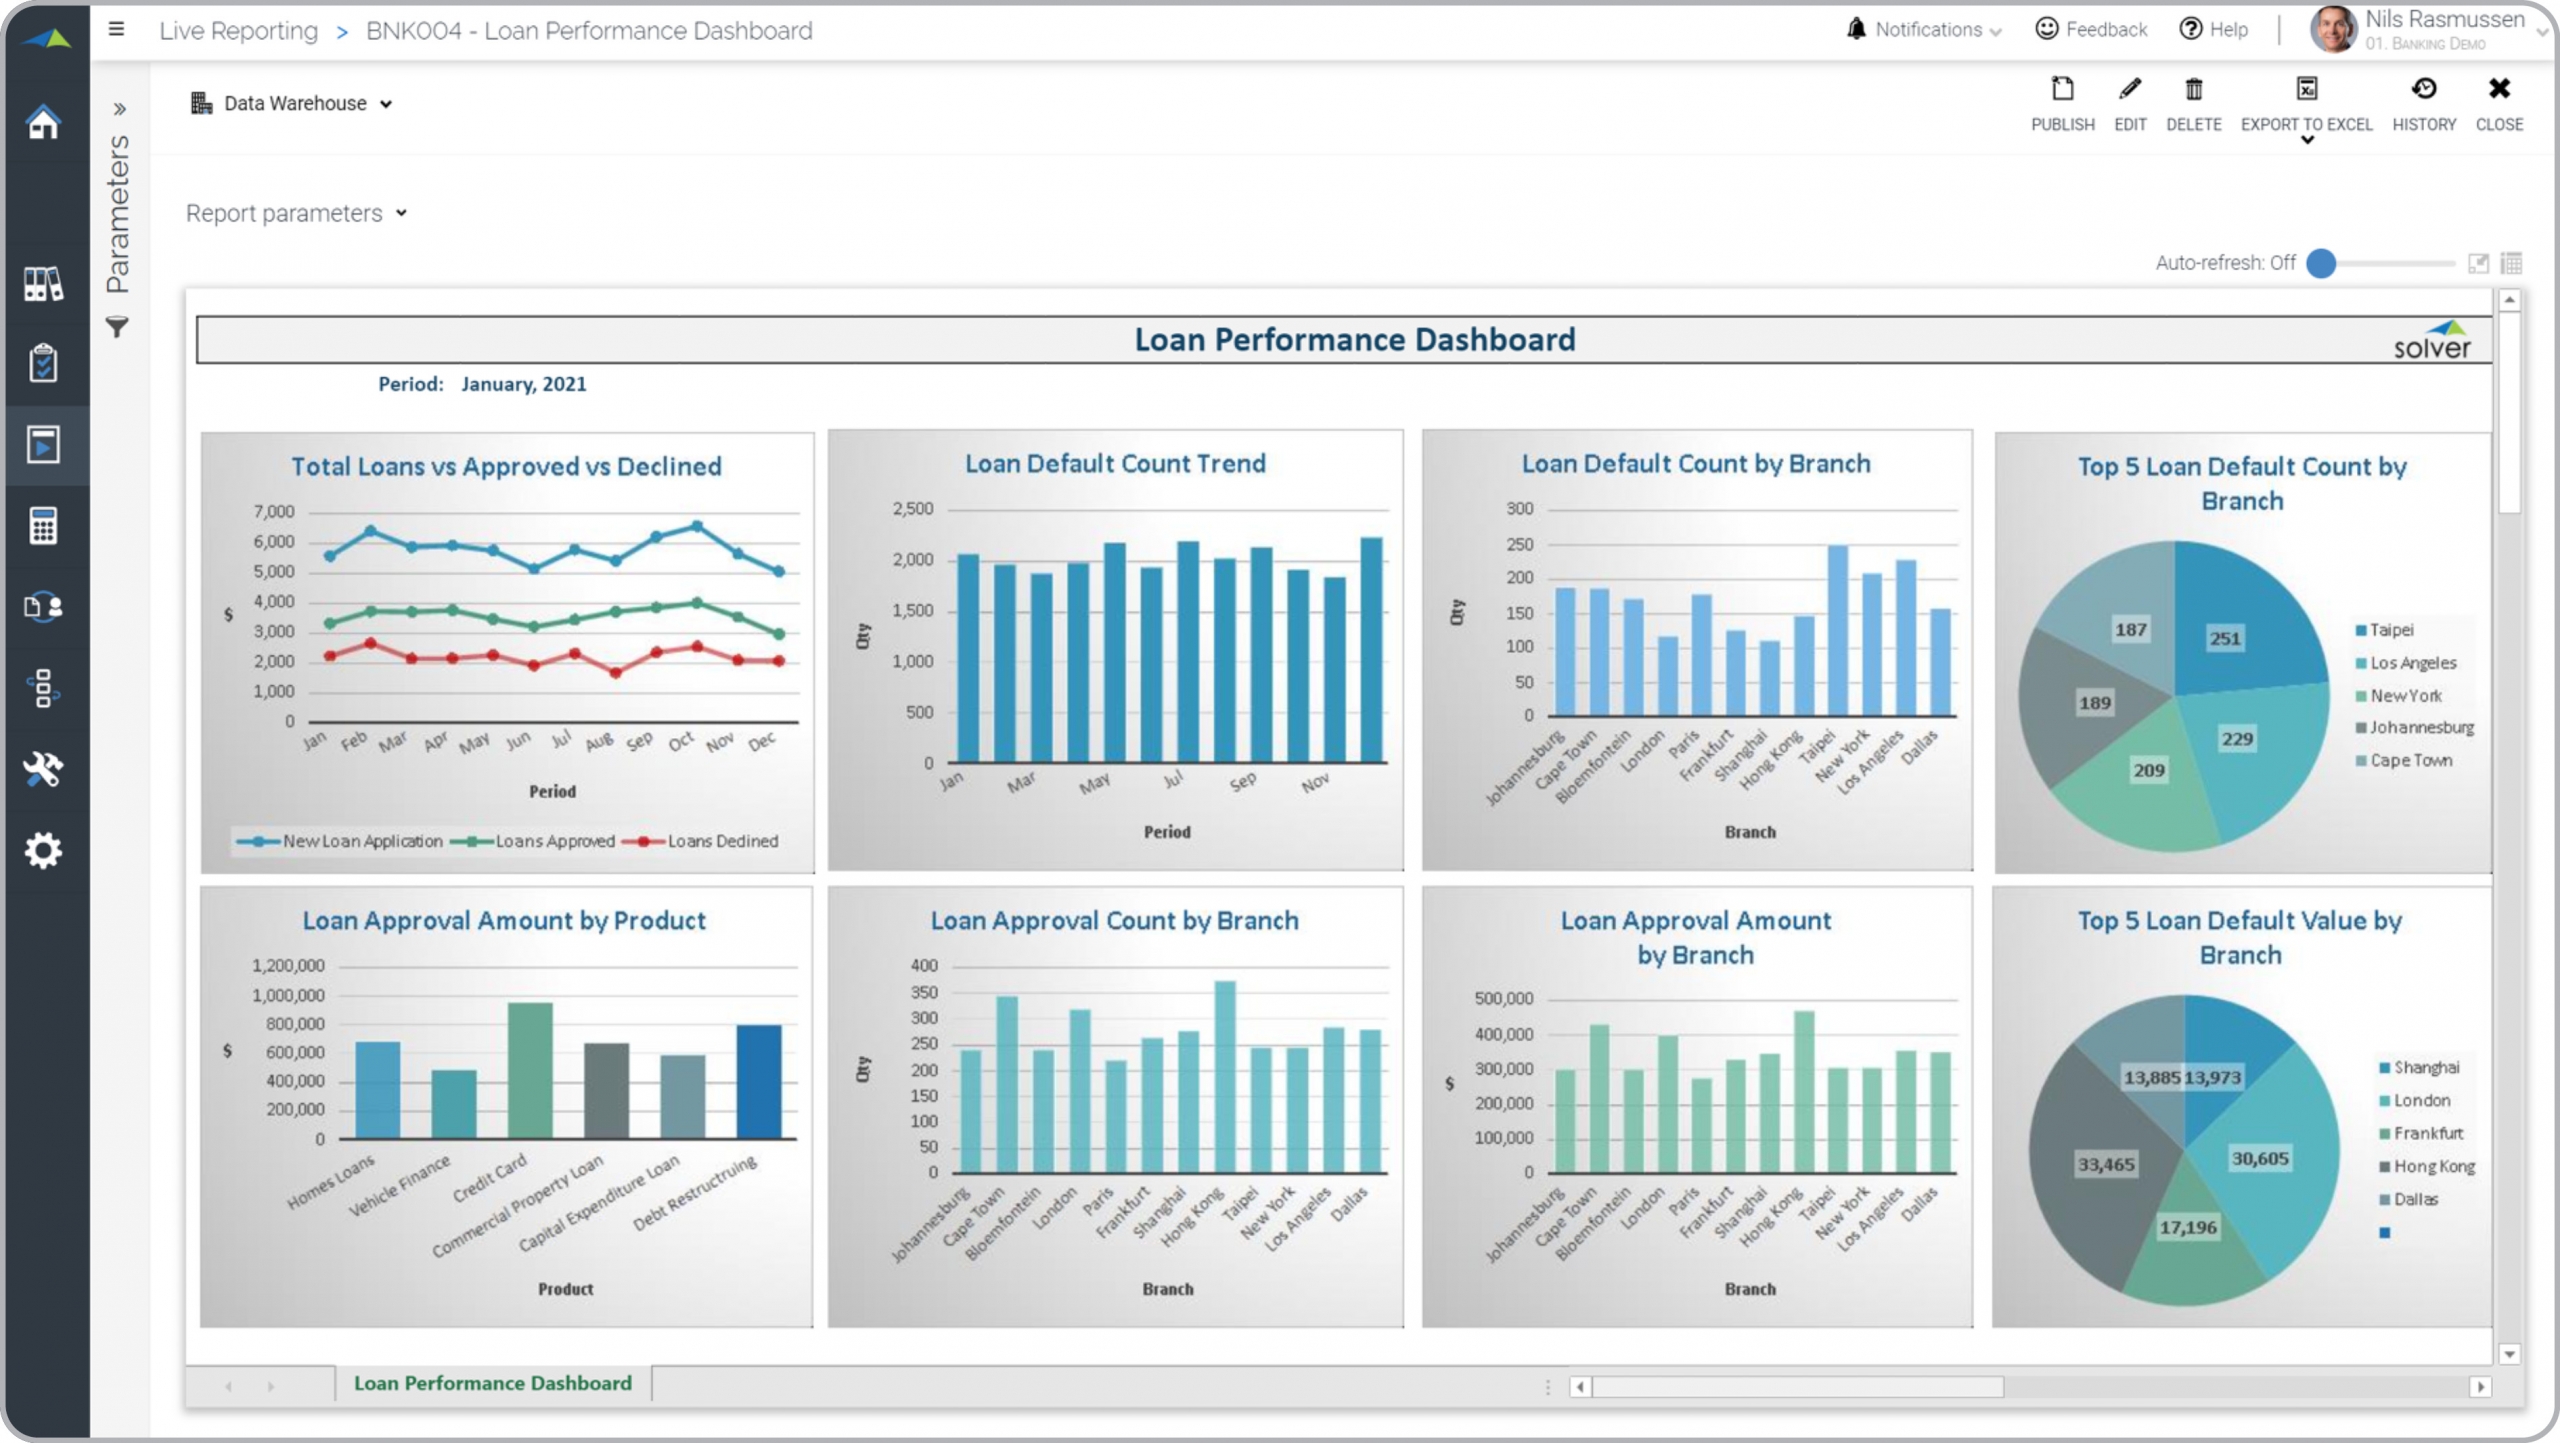
What is a Loan Performance Dashboard for Banks? Loan Performance Dashboards are considered operational analysis tools and are used by executives and loan officers to monitor approval and default trends and comparisons. Some of the main functionality in this type of dashboard is that it provides analysis from eight different perspectives including: 1) Monthly trend in total loan applications and loans approved versus declined, 2) Loans approved by product, 3) Monthly trend in loan defaults, 4) Loan approval count by branch, 5) Loan default count by branch, 6) Loan approval amount by branch, 7) Top five loan default count by branch, and 8) Top five loan default amounts by branch. You find an example of this type of dashboard below.
Purpose of Loan Performance Analysis Dashboards Banks use Loan Performance Analysis Dashboards to give leaders an easy way to monitor loan trends and benchmark metrics across bank branches. When used as part of good business practices in Executive-, Loan- and Financial Planning & Analysis (FP&A) departments, a bank can improve its loan strategies and offerings, and it can reduce the chances that poorly designed policies leads to excessive loan defaults.
Who Uses This Type of Dashboard? The typical users of this type of dashboard are: Executives, CFOs, Loan Managers, Analysts, Regional Managers, Branch Managers. Other Reports Often Used in Conjunction with Loan Performance Analysis Dashboards Progressive Executive-, Loan- and Financial Planning & Analysis (FP&A) departments sometimes use several different Loan Performance Analysis Dashboards, along with detailed and summary loan reports, profit & loss reports, balance sheets, cash flow statements, budget models, forecasts and other management and control tools.
Where Does the Data for Analysis Originate From? The Actual (historical transactions) data typically comes from enterprise resource planning (ERP) systems. In analyses where budgets or forecasts are used, the planning data most often originates from in-house Excel spreadsheet models or from professional xFP&A solutions.
Built for banking finance teams and aligned with Solver's xFP&A platform, this Solver dashboard template connects directly to your ERP data via the Solver Data Warehouse, enabling near real-time analysis with minimal setup. Designed for QuickStart deployment, it can be activated rapidly so your team can focus on analysis and decisions — not data preparation.
What is the Bank – Loan Performance Dashboard in Solver? The Bank – Loan Performance Dashboard is a pre-built xFP&A dashboard template in Solver designed for banking organizations. It delivers key financial and operational metrics in a single, easy-to-use interface — purpose-built for banking finance workflows.
Who uses this Solver dashboard template? Cfos, finance managers, and bank executives in banking organizations rely on this Solver dashboard template to replace manual spreadsheet-based processes with automated, near real-time analysis. It is especially useful during month-end close, budget cycles, and board reporting.
Where does the data come from? Data is sourced automatically from your ERP system through the Solver Data Warehouse. Core banking systems and loan management platforms are also supported as data sources. Once connected, the template updates in near real-time with no manual data entry required.
To learn more, visit the Resource Library.