
This article is part 2 of an 8-part series on evaluating the best CPM tools for your business. Part 2 focuses on feature sets within the best financial reporting software applications.
Financial reporting software that also offers consolidations and planning functionality belongs to a software category typically referred to as Corporate Performance Management (CPM). Some also refer to this as Enterprise Performance Management (EPM). Since most organizations are either currently planning to or have recently moved their ERP systems to the cloud, cloud-based financial reporting solutions are now more popular than ever. While native ERP report writers are able to produce financial statements and sub-ledger reports, they are generally not great at formatting and advanced formulas. Plus, since they are built into the ERP system, they can’t report on data in other data sources. So, almost always, companies export some or many of their reports to Excel to finalize and assemble them there. As a result, an entire industry of cloud-based reporting solutions has sprung up to take companies’ reporting automation and month-end close processes to the next level. There are numerous software vendors that now deliver independent reporting solutions, either stand-alone or as part of a CPM suite. As a result, during a software selection process you’ll need to carefully choose the solution that is RIGHT for your business. This means that the functionality must be right for your unique business and that it should support your industry-specific requirements. And, of course, the
return on investment (ROI) needs to be positive. When working through a software selection process to find the best financial reporting software for your organization, there are always some features that are more important than others.
Here are some of the top features to look for to find the best financial reporting software While most vendors can probably showcase more than 100 features in their product (something which can make software selection a painful process), the main success criteria can be narrowed down to a few key areas. Each one is listed and discussed below.
 Note 1: Be aware of CPM vendors that offer two report designers because that means twice as much training for power users. It can become messy in the month-end close process, report packages, and other areas if templates are created with two different technologies. The reason for two tools is almost always that the functionality in the vendor’s proprietary designer was not enough for their customers, so they later added an Excel designer to handle complex customer models with a lot of formatting.
Note 2: In addition, be aware of sales pitches that use “sexy” dashboards to draw your attention away from questions around great formatting in financial statements. While dashboards are awesome management tools focused on graphical analysis, they are NOT built to be financial report writers that can easily develop and maintain things like GL account structures behind Profit & Loss, Balance Sheets, Cash Flow Statements, and other critical reports. Without a report designer in your new planning solution, you are at high risk of significantly having to change your favorite report formats to fit the capability of the vendor’s tool. In many cases, you may even find yourself and your staff relying still on your overloaded Excel spreadsheets because you’ll be exporting reports to Excel and then manually reformatting them every month.
Here is list of about 500 examples of reports, dashboards, and budgeting templates. It is a good idea to ask your vendor candidates if you can see examples from their template libraries. The more examples they provide, the more you can be assured that their solution has a good report designer.
Note 1: Be aware of CPM vendors that offer two report designers because that means twice as much training for power users. It can become messy in the month-end close process, report packages, and other areas if templates are created with two different technologies. The reason for two tools is almost always that the functionality in the vendor’s proprietary designer was not enough for their customers, so they later added an Excel designer to handle complex customer models with a lot of formatting.
Note 2: In addition, be aware of sales pitches that use “sexy” dashboards to draw your attention away from questions around great formatting in financial statements. While dashboards are awesome management tools focused on graphical analysis, they are NOT built to be financial report writers that can easily develop and maintain things like GL account structures behind Profit & Loss, Balance Sheets, Cash Flow Statements, and other critical reports. Without a report designer in your new planning solution, you are at high risk of significantly having to change your favorite report formats to fit the capability of the vendor’s tool. In many cases, you may even find yourself and your staff relying still on your overloaded Excel spreadsheets because you’ll be exporting reports to Excel and then manually reformatting them every month.
Here is list of about 500 examples of reports, dashboards, and budgeting templates. It is a good idea to ask your vendor candidates if you can see examples from their template libraries. The more examples they provide, the more you can be assured that their solution has a good report designer.
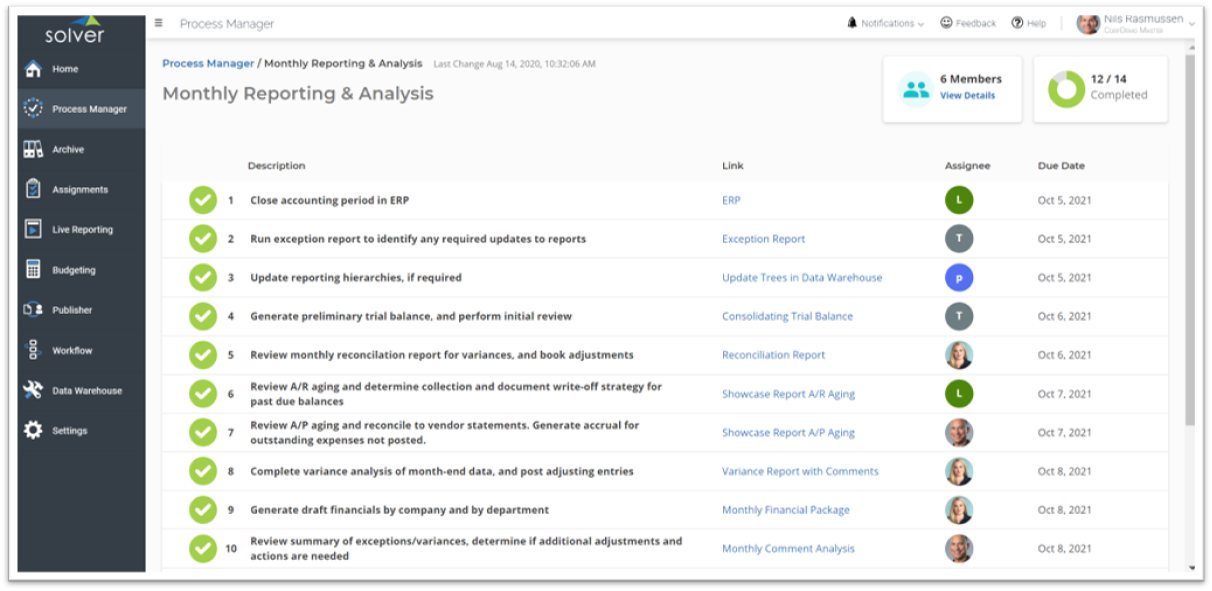 Without a good workflow module and checklists, chances are good that you are spending a lot more time reminding people of deadlines and asking them for feedback or comments. This level of constant follow up can get even more frustrating and complex if you are stuck managing tasks manually in companies that have multiple subsidiaries and large accounting teams involved in the month-end close.
- Advanced report formatting
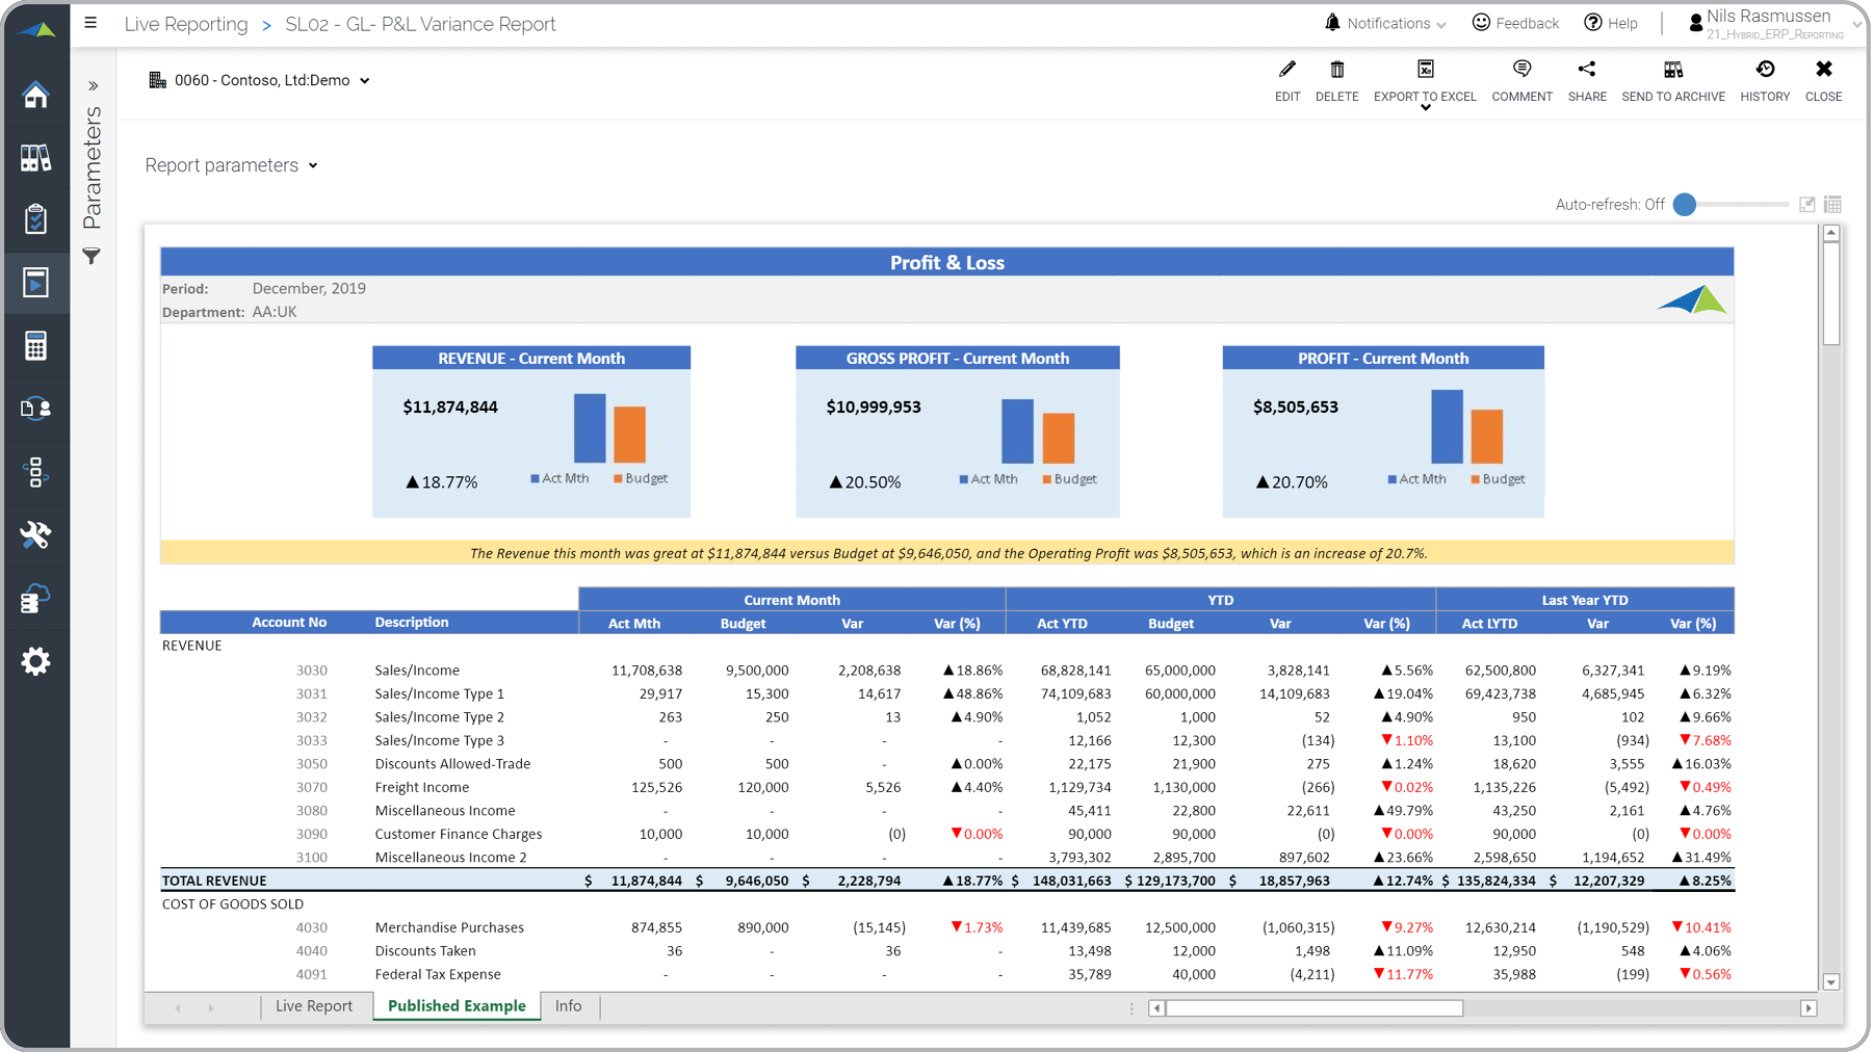
P&L – Variance Report (Copyright - Solver, Inc.)
- Advanced formulas
- Advanced consolidations
- Manual intercompany elimination entries with comments and audit trail
- Automatic intercompany eliminations
- Currency conversion
- Roll-up of balances from subsidiaries with different chart of accounts
- Ability to enter and track additional “topside” adjustments where needed
- Advanced closing and reporting process checklist
- Closing of the books in the ERP system and transferring the data to the reporting solution
- Viewing exception and reconciliation reports to flag issues and reconcile items
- Running trial balance reports
- Adjusting entries (in ERP or CPM tool)
- Running of all month-end reports
- Performing variance and trend analysis with comments
- Publishing (web viewing, email, or Excel) monthly reports with comments
- Sending PowerPoint presentations to the executive team
Interactive Checklist for Monthly Reporting
- Pre-built ERP integrations
- Is the integration to your ERP in real time or is data exported to the CPM solution’s cloud database? (There are pros and cons of both.)
- How frequently can the data from the ERP be refreshed within the reporting tool?
- Is the ERP integration pre-configured or do you have to map and configure it?
- Does the report writer only work well with GL data or can you also bring in sub-ledger transactions and non-ERP data?
- Will the integration pick up changes such as new accounts and companies?
- Built for cloud
- Does the annual subscription from each vendor contain the same user count and modules?
- If you are receiving a discount, how long until it resets to the list price?
- Does the vendor have a written policy for annual price increases?
- Are the implementation estimates from each vendor for exactly the same work?
- Painful manual report distribution
- Troubles with consolidation of spreadsheets
- Broken links
- Poor reporting flexibility
- Lack of user security
- Versioning issues
- and so on…
- Vendor Comparison Tool and ROI Calculator
- Solver Tour Central
- 500+ Budget and Report Examples
- Analyst reports and ratings: G2 and Dresner
- Software Selection Blog
- QuickStart - 1 day deployment with pre-built templates
January 18, 2021
TAGS: Reporting, Solver, report writer, Microsoft, Netsuite, planning, Business Central, excel, forecasting, Dynamics 365, budgeting, Sage Intacct, d365 finance, CPM, Power BI, EPM, consolidations, best financial reporting software, best software, Management Reporter, prophix, PowerPoint, best tools, Excel-based budgeting, Vena, jet reports, Excel-based reporting, software comparison, Azure, SAP Business One, sap bydesign, dynamics nav, best report writers, best consolidation software, dynamics gp, best reporting software, anaplan, Adaptive Insight, Planful, Teams