Example of an Expense Dashboard with Trends and Variances to Streamline the Monthly Reporting Process
The Expense Dashboard with Trends and Variances is a ready-to-use Financial Dashboard from the Solver Marketplace A Brief Description of the Expense Dashboard with Trends and Variances Template Financial Dashboards like the one seen in the image above are interactive and parameter driven and typically contain sections with matrix variance reports by account category and account, as well as trend charts and comparative charts. One of the important features that aid the user in the analysis process is the ability to click on any row in the two tables and see that GL expense category or account highlighted in each chart. Expense Dashboard with Trends and Variances are often used in conjunction with revenue dashboards, profit & loss reports, exception dashboards, and forecast input models. Data Integration to Transaction Systems Most organizations these days want automated and streamlined 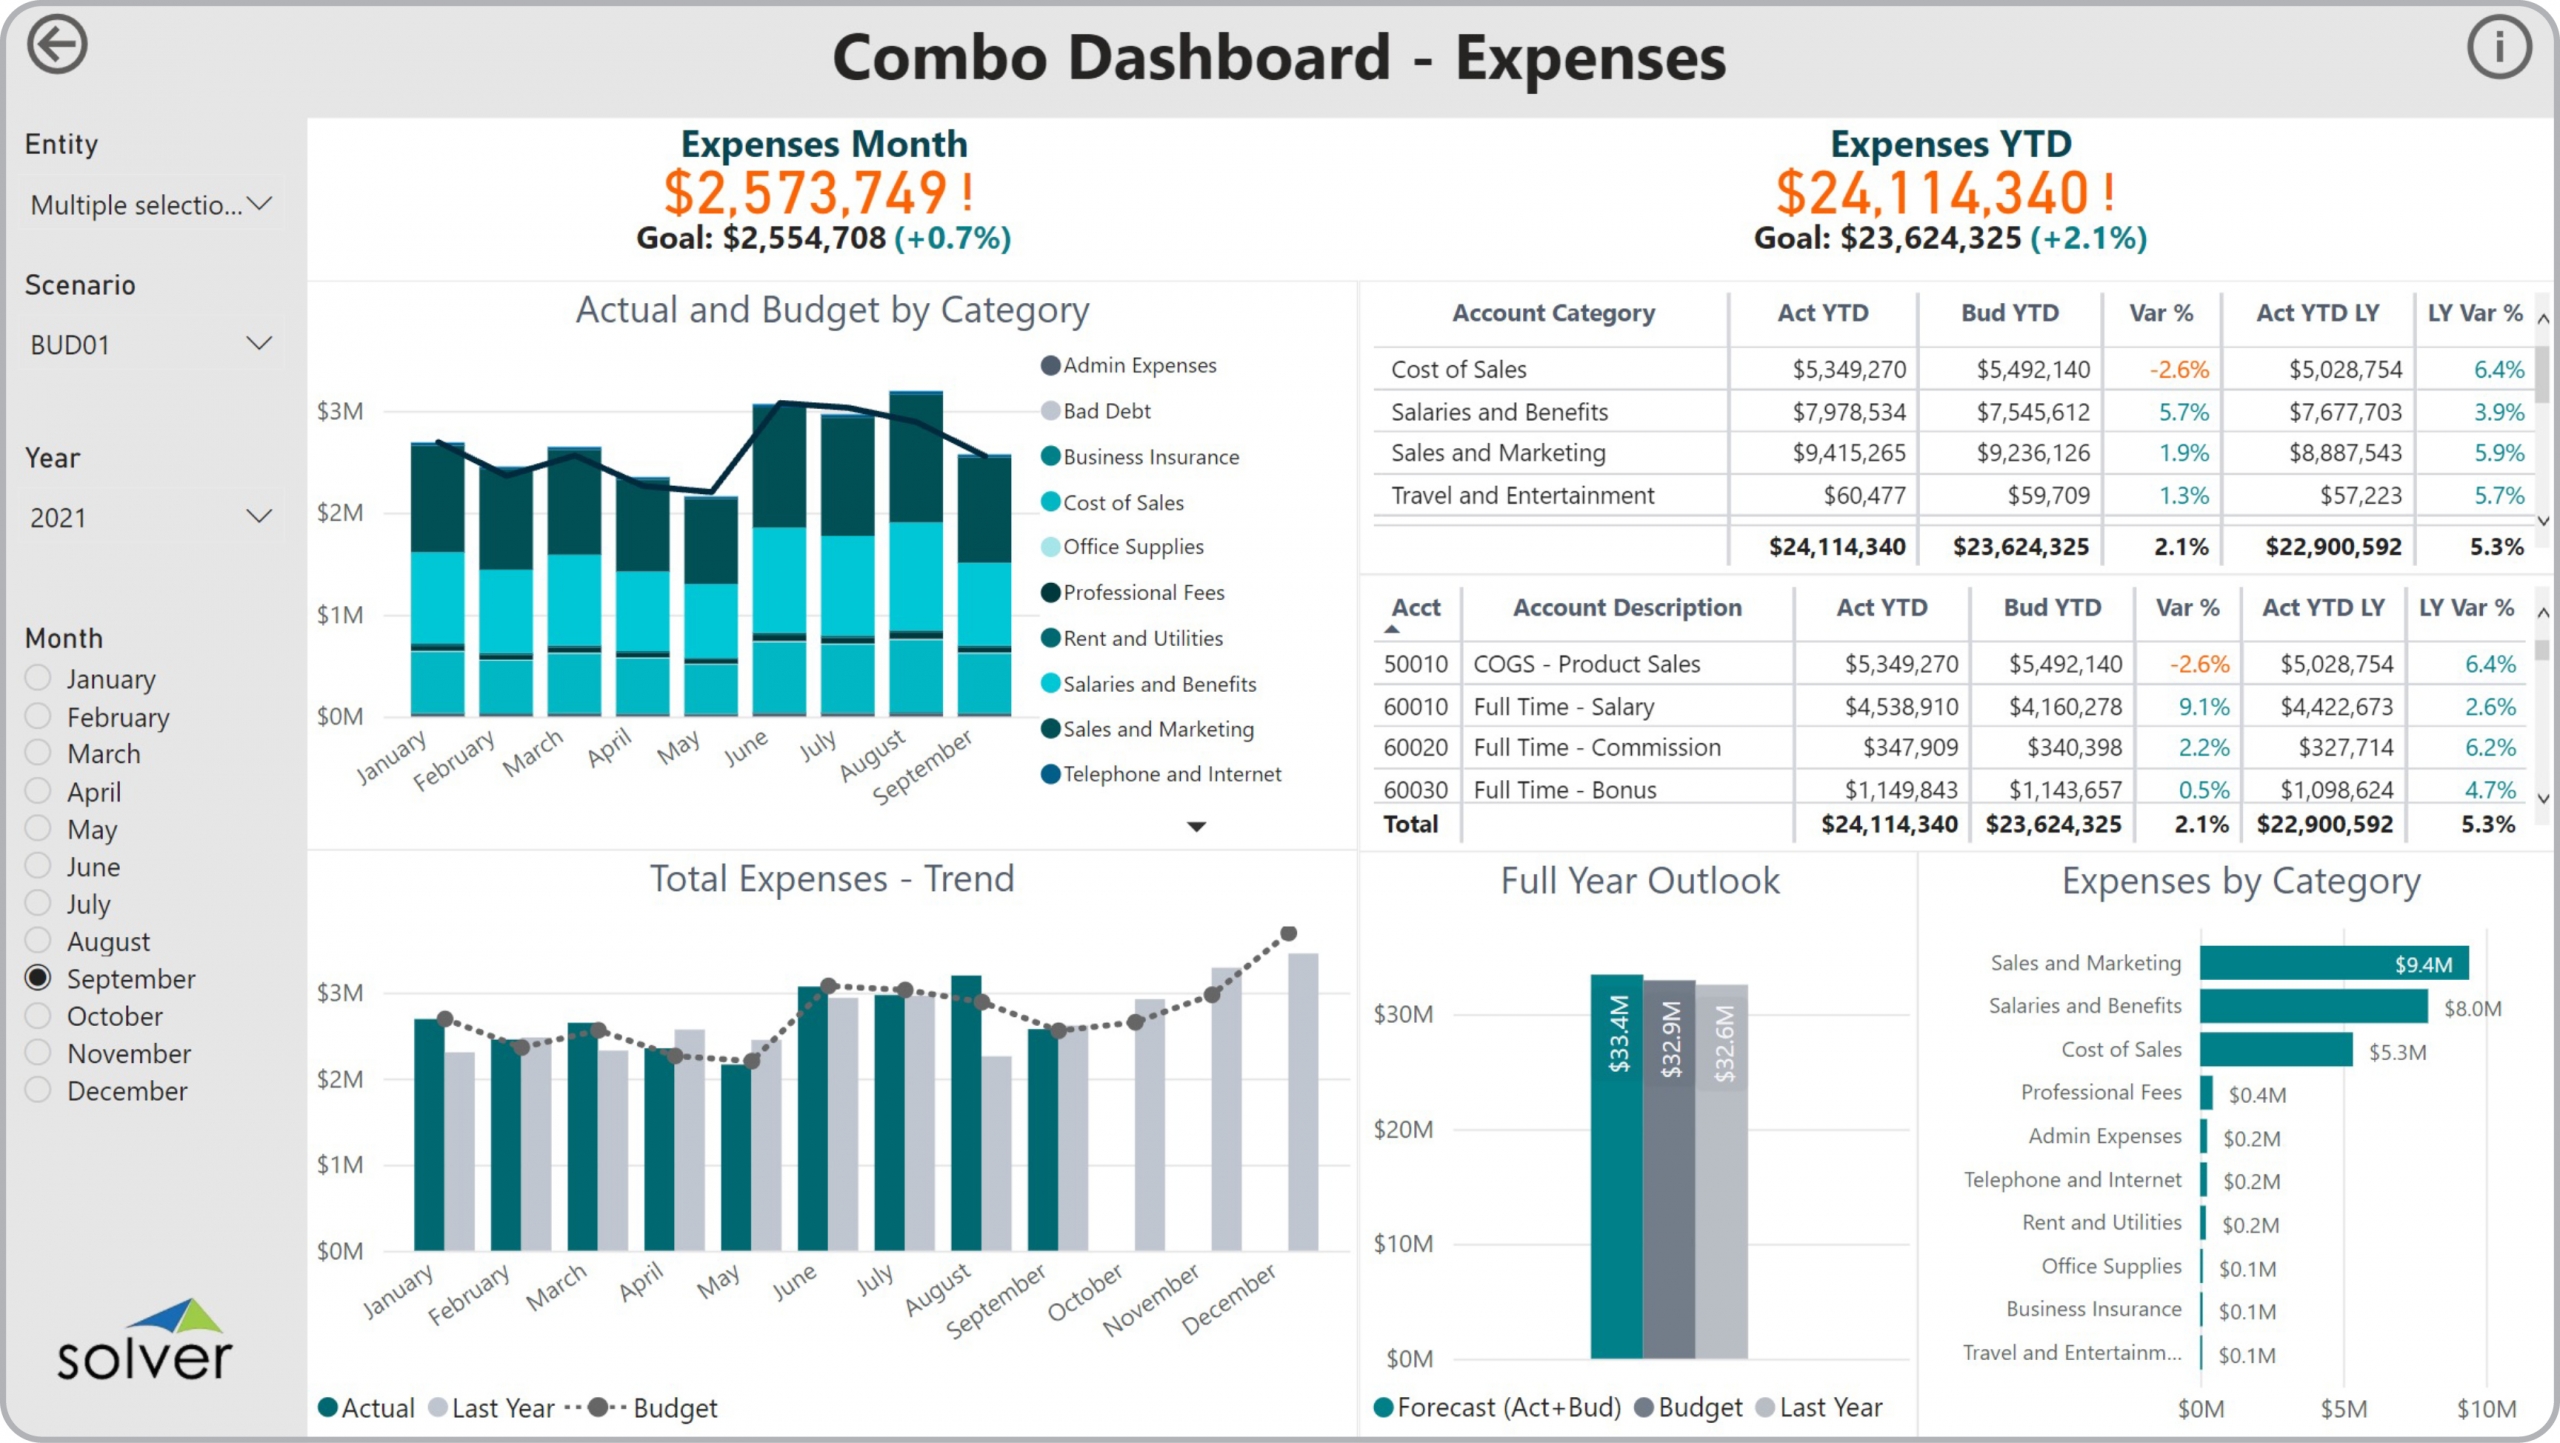