The 48 Month Profitability Trend Dashboard template can be used as a key element of the Monthly Reporting process:
The 48 Month Profitability Trend Dashboard is a ready-to-use Financial Dashboard from the Solver Marketplace.
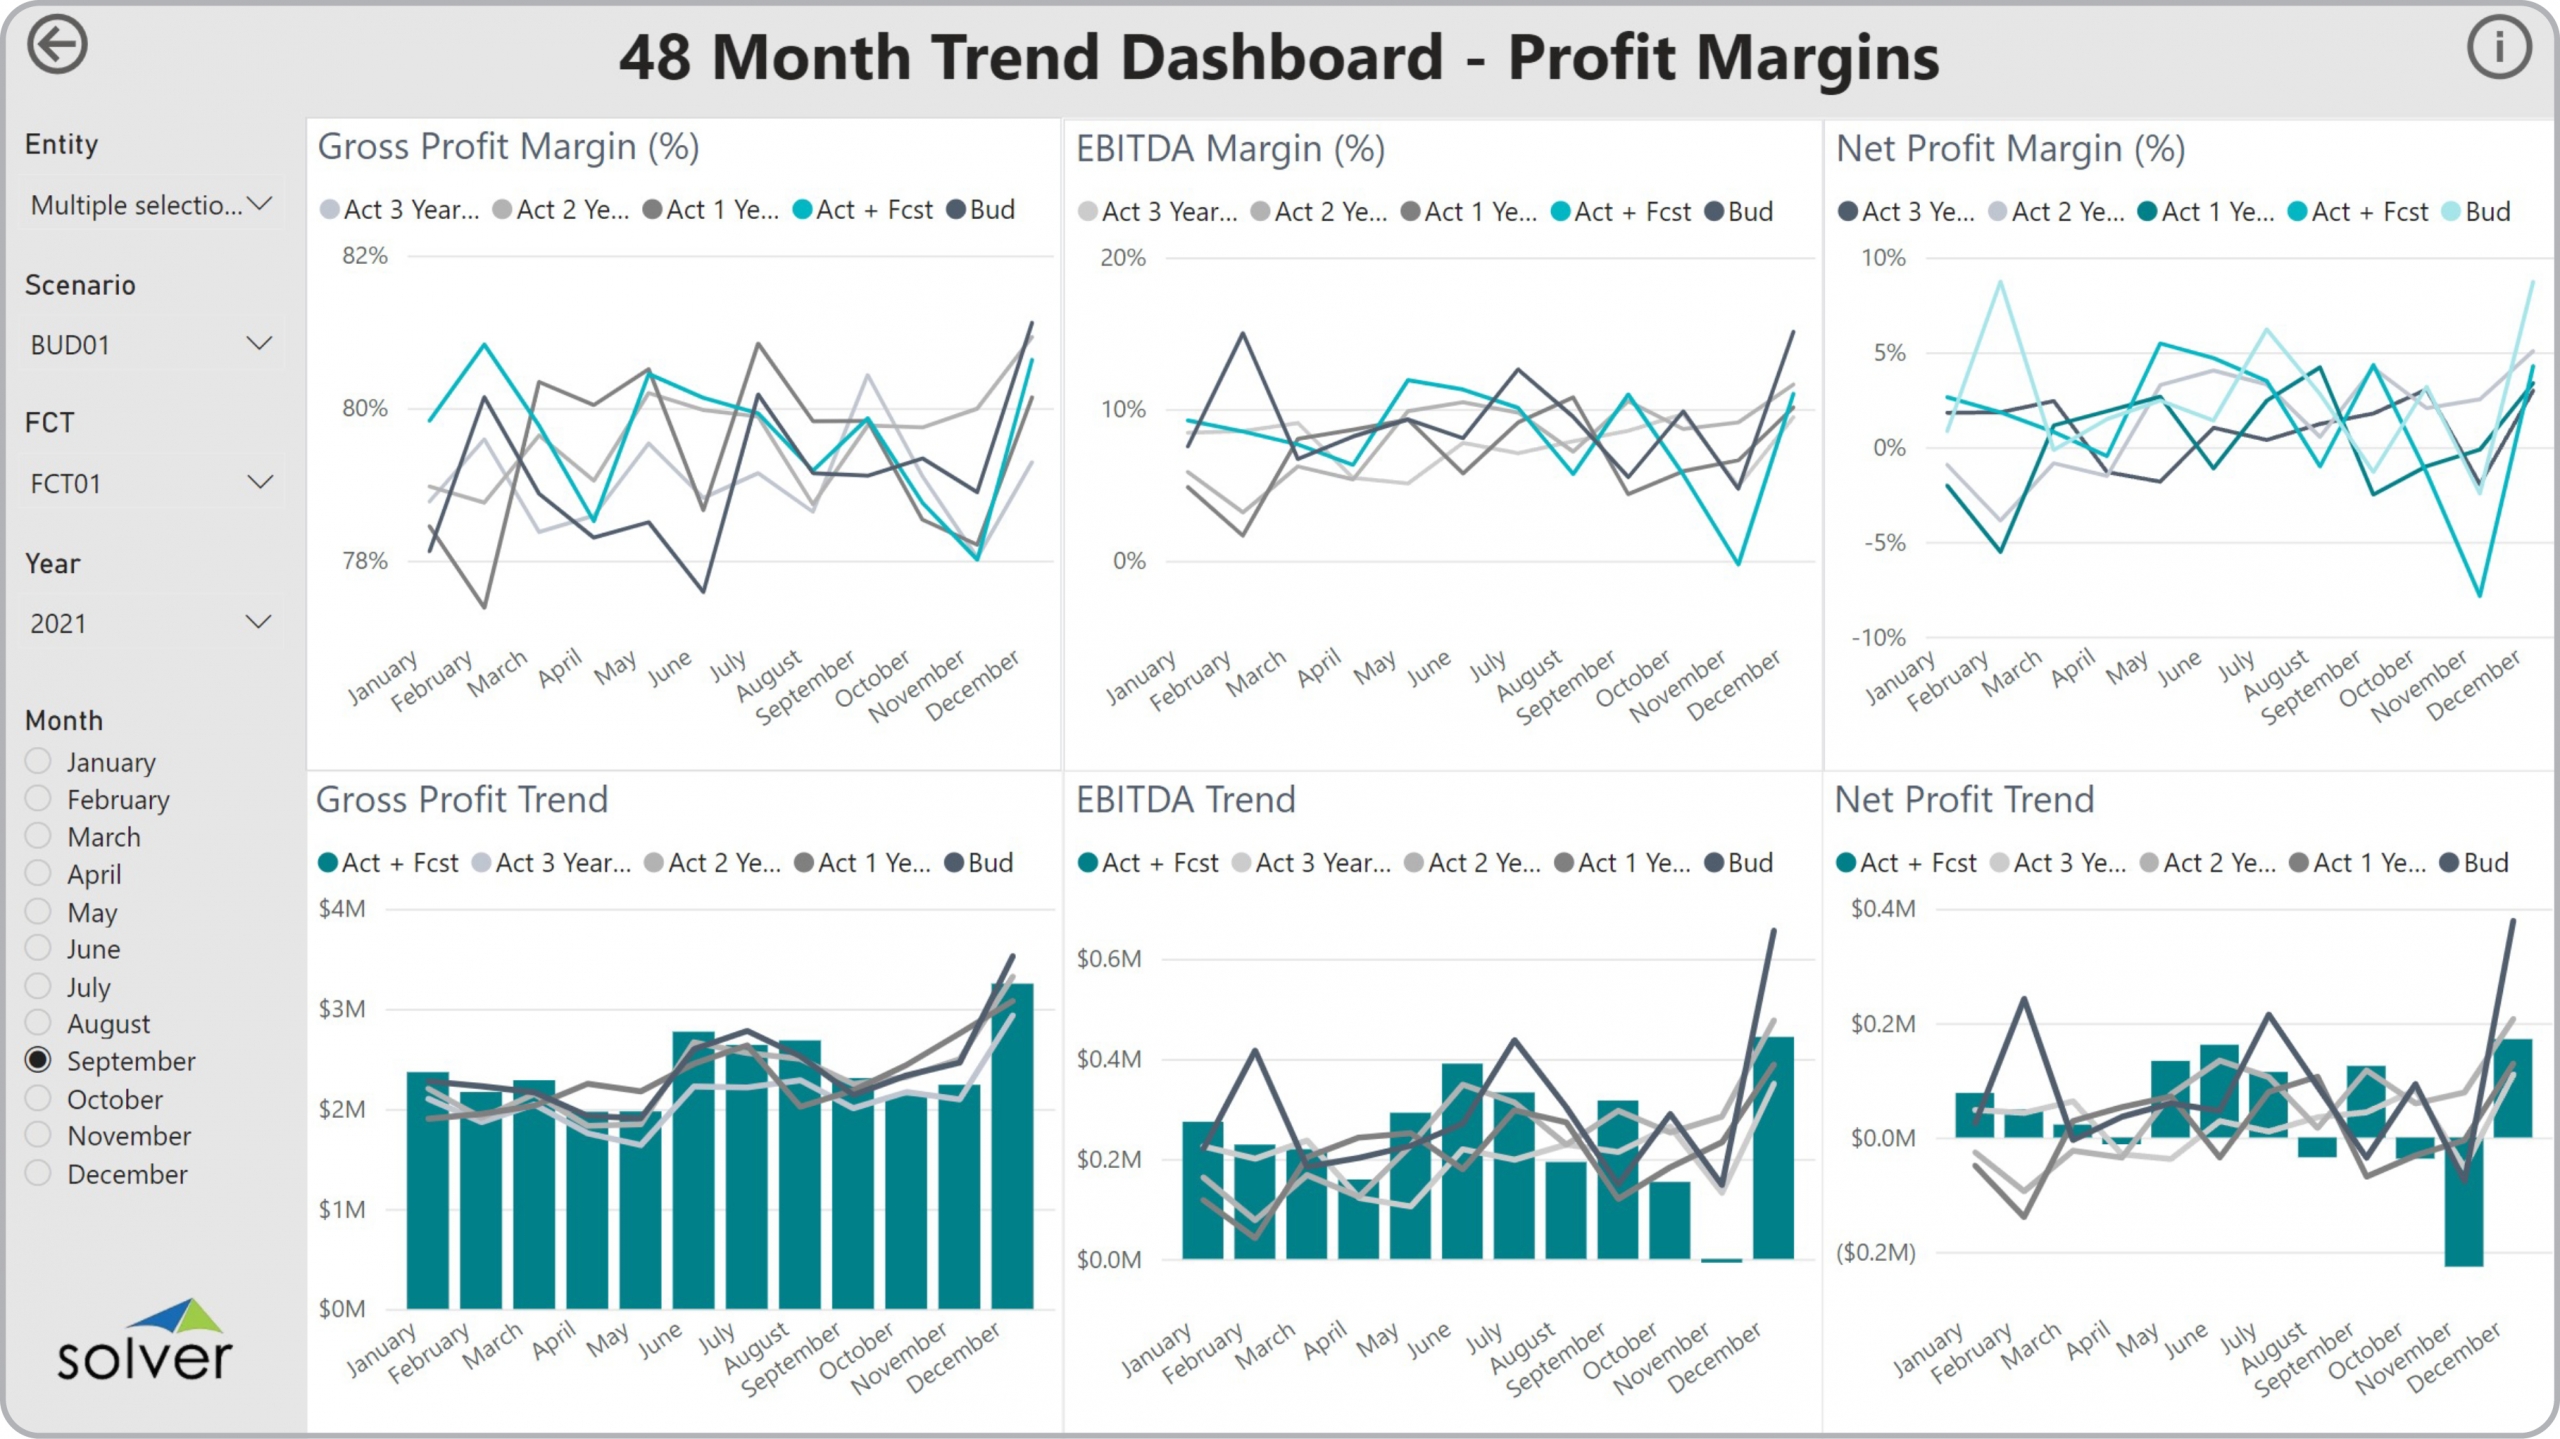
A Brief Description of the 48 Month Profitability Trend Dashboard Template Financial Dashboards like the one seen in the image above are interactive and parameter driven and typically contain sections with Gross Profit, EBITDA and Net Profit metrics. One of the important features that aid the user in the analysis process is the ability to view percent (%) and amounts in the same dashboard to analyze materiality. 48 Month Profitability Trend Dashboards are often used in conjunction with budget models, profit & loss trend and variance reports, cash flow statements and KPI dashboards.
Data Integration to Transaction Systems Most organizations these days want automated and streamlined planning, reporting and analysis. However, many of the benefits described earlier rely on best of breed Corporate Performance Management (CPM) tools and/or Business Intelligence (BI) capabilities as well as data marts or data warehouses that use pre-built integrations to the organization’s ERP system. Oftentimes, they also need integrations to other key data sources like CRM, subscription systems, payroll tools, etc. Modern, cloud-based ERPs like Microsoft Dynamics 365 Finance (D365 Finance), Microsoft Dynamics 365 Business Central (D365 BC), Sage Intacct, Acumatica, Netsuite and SAP have robust APIs which allow for dynamic integrations to CPM and BI tools that are fully automated and flexible to run on a schedule or on-demand.
Additional Resources to Aid with Research of Templates, CPM and BI Tools