
This article continues the discussion of the top five problems facing CEOs today in regard to corporate performance management, with a focus on reporting.
In interviewing a very successful CEO and founder of a large company, he expressed the corporate performance management (CPM) issues he faced, and all of them are echoed by hundreds of other executives I have spoken with in recent years. He then explained his vision of the “ideal” solution to his issues. In summary, these were the problems he faced:
 The vast majority of organizations have at least five or more reporting, query and analysis tools for their different data sources. Some are web-based, some use proprietary client-server interfaces, some are easy to use and others are very technical and require IT help to design and maintain; most of them require different training classes and have different security models. In other words, it is a mess! And this is still the situation almost everywhere, seriously hampering the opportunity for managers to use world-class decision-making simply because, even if all the required reports are available, which is rarely the case, data is spread across numerous tools, with different report formats, different skill requirements to use, different logins and different methods to access, etc. In many cases, the required reports are not available, but managers don’t know how to modify or create a new report, so it never gets done; users export or enter the data in manual Excel models, or they simply learn to live without that information. Now, if you have implemented a data warehouse to resolve the issue of data spread across many data sources, you have also enabled the opportunity to implement a single BI solution for analysis and decision-making to eliminate the issue with many reporting tools that was described above. However, once an organization is given a powerful, single BI solution and easy access to all important data through a data warehouse, a new problem often occurs: dozens if not hundreds of reports and dashboards are built by eager users, which easily results in “many versions of the truth” because business rules are defined differently by different users (there are ways to resolve this by the way, with a central key performance indicator (KPI) repository in the BI tool), and managers simple can’t find the right or the best dashboard or report anymore. This can be resolved by agreeing to corporate standard reports that are maintained by designated staff and flagged/organized separately from individual user-defined reports. It can also be nicely avoided by creating storyboards or playlists that have the best reports and dashboards in the best order of analysis. For example, starting with summary metrics and then going to detailed back-up information that users can use when needed.
Issue 4: Managers are not able to monitor their important metrics and quickly take action when there is an issue.
Solution: Create exception reports that are emailed to managers and that require online commentary when there is an exception. The reports should be very simple to read and focused on agreed-upon KPIs. While implementing a data warehouse to bring all data important for decision-making into a single data store solves the problem of having to use many report writers or having to manually combine data in Excel, it does not solve the question of
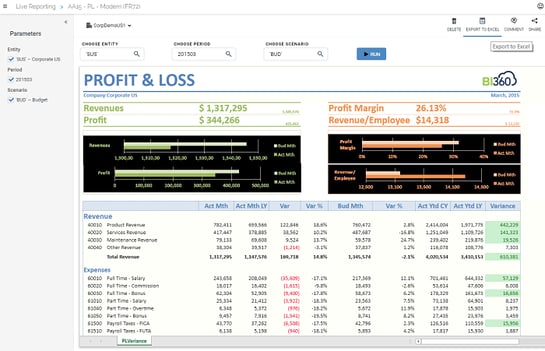
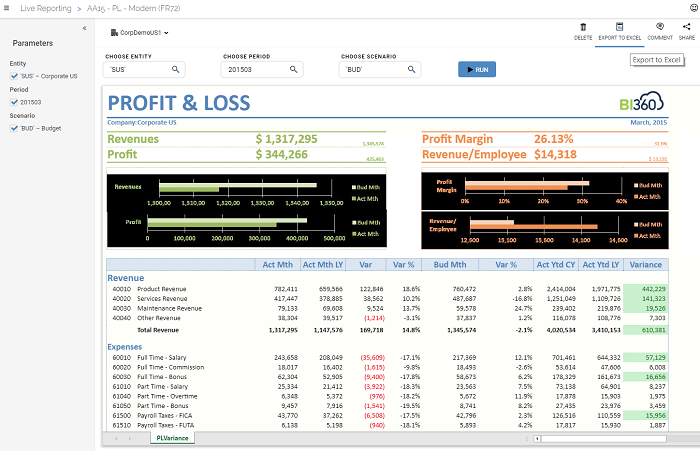
how the information is consumed by your decision-makers. Even if you achieved the ideal state of only using one report writer and one dashboard tool and they are completely integrated into the same easy-to-access web portal, you may still have a big problem that reduces the quality and speed of decisions. Let’s say a manager can do most of his or her analysis based on six or seven KPIs or metrics, but that these are spread across a profit & loss report, a sales report, an inventory report and a dashboard. Chances are that this manager will make sub-optimal decisions because the person will miss or forget information while hopping from one report to another. So the power of a simple KPI-based summary report that highlights important exceptions can be huge for world-class decision-making. Such a report should come with links, drill down to detailed transaction reports and dashboards with trend analysis, and so on, so that as soon as the manager finds a problem or an opportunity in the KPI report, he or she can quickly and easily navigate directly to the detailed information for further analysis. Two other key features on such a report should be the ability for the user to enter a comment on the pertinent line items, and the BI tool should also be able to be set up to automatically e-mail the report to the user if there is a flagged exception so that no time is lost in the decision-making process. The commentary serves several purposes, including reducing the need for the same person or other people to go back and repeat the same analysis just to derive the same conclusion. It also provides an ability to do “comment comparison” over time. In other words, if the same issue keeps arising multiple times or it is not resolved, analyzing the comments helps see if the manager’s analysis of the problem is correct or why his or her proposed solution actually did not work. To be continued: next week, this blog will cover the remaining common problem faced in reporting and analysis from an executive’s perspective.
Solver enables world-class decisions with
BI360,
a
leading web-based CPM suite
made up of budgeting, reporting, dashboards, and data warehousing, delivered through a web portal. Solver offers BI360 through cloud and on-premise deployment and is reinventing CPM with its next generation solution. BI360 empowers business users with modern features including innovative use of Excel in the model design process. If you’re interested in learning more,
our team is excited to hear about your organizational needs and goals
The vast majority of organizations have at least five or more reporting, query and analysis tools for their different data sources. Some are web-based, some use proprietary client-server interfaces, some are easy to use and others are very technical and require IT help to design and maintain; most of them require different training classes and have different security models. In other words, it is a mess! And this is still the situation almost everywhere, seriously hampering the opportunity for managers to use world-class decision-making simply because, even if all the required reports are available, which is rarely the case, data is spread across numerous tools, with different report formats, different skill requirements to use, different logins and different methods to access, etc. In many cases, the required reports are not available, but managers don’t know how to modify or create a new report, so it never gets done; users export or enter the data in manual Excel models, or they simply learn to live without that information. Now, if you have implemented a data warehouse to resolve the issue of data spread across many data sources, you have also enabled the opportunity to implement a single BI solution for analysis and decision-making to eliminate the issue with many reporting tools that was described above. However, once an organization is given a powerful, single BI solution and easy access to all important data through a data warehouse, a new problem often occurs: dozens if not hundreds of reports and dashboards are built by eager users, which easily results in “many versions of the truth” because business rules are defined differently by different users (there are ways to resolve this by the way, with a central key performance indicator (KPI) repository in the BI tool), and managers simple can’t find the right or the best dashboard or report anymore. This can be resolved by agreeing to corporate standard reports that are maintained by designated staff and flagged/organized separately from individual user-defined reports. It can also be nicely avoided by creating storyboards or playlists that have the best reports and dashboards in the best order of analysis. For example, starting with summary metrics and then going to detailed back-up information that users can use when needed.
Issue 4: Managers are not able to monitor their important metrics and quickly take action when there is an issue.
Solution: Create exception reports that are emailed to managers and that require online commentary when there is an exception. The reports should be very simple to read and focused on agreed-upon KPIs. While implementing a data warehouse to bring all data important for decision-making into a single data store solves the problem of having to use many report writers or having to manually combine data in Excel, it does not solve the question of
how the information is consumed by your decision-makers. Even if you achieved the ideal state of only using one report writer and one dashboard tool and they are completely integrated into the same easy-to-access web portal, you may still have a big problem that reduces the quality and speed of decisions. Let’s say a manager can do most of his or her analysis based on six or seven KPIs or metrics, but that these are spread across a profit & loss report, a sales report, an inventory report and a dashboard. Chances are that this manager will make sub-optimal decisions because the person will miss or forget information while hopping from one report to another. So the power of a simple KPI-based summary report that highlights important exceptions can be huge for world-class decision-making. Such a report should come with links, drill down to detailed transaction reports and dashboards with trend analysis, and so on, so that as soon as the manager finds a problem or an opportunity in the KPI report, he or she can quickly and easily navigate directly to the detailed information for further analysis. Two other key features on such a report should be the ability for the user to enter a comment on the pertinent line items, and the BI tool should also be able to be set up to automatically e-mail the report to the user if there is a flagged exception so that no time is lost in the decision-making process. The commentary serves several purposes, including reducing the need for the same person or other people to go back and repeat the same analysis just to derive the same conclusion. It also provides an ability to do “comment comparison” over time. In other words, if the same issue keeps arising multiple times or it is not resolved, analyzing the comments helps see if the manager’s analysis of the problem is correct or why his or her proposed solution actually did not work. To be continued: next week, this blog will cover the remaining common problem faced in reporting and analysis from an executive’s perspective.
Solver enables world-class decisions with
BI360,
a
leading web-based CPM suite
made up of budgeting, reporting, dashboards, and data warehousing, delivered through a web portal. Solver offers BI360 through cloud and on-premise deployment and is reinventing CPM with its next generation solution. BI360 empowers business users with modern features including innovative use of Excel in the model design process. If you’re interested in learning more,
our team is excited to hear about your organizational needs and goals
- Lacking one version of the truth when discussing performance.
- Lack of accountability because management commentary was not tracked along with their reports.
- “Analysis paralysis” – too many reports, too many versions, and too many reporting tools.
- Lack of core exception reports that immediately are sent to managers when there is an issue.
- Lack of agile, strategically focused, centrally controlled, top-down, bottom-up budget process.
 The vast majority of organizations have at least five or more reporting, query and analysis tools for their different data sources. Some are web-based, some use proprietary client-server interfaces, some are easy to use and others are very technical and require IT help to design and maintain; most of them require different training classes and have different security models. In other words, it is a mess! And this is still the situation almost everywhere, seriously hampering the opportunity for managers to use world-class decision-making simply because, even if all the required reports are available, which is rarely the case, data is spread across numerous tools, with different report formats, different skill requirements to use, different logins and different methods to access, etc. In many cases, the required reports are not available, but managers don’t know how to modify or create a new report, so it never gets done; users export or enter the data in manual Excel models, or they simply learn to live without that information. Now, if you have implemented a data warehouse to resolve the issue of data spread across many data sources, you have also enabled the opportunity to implement a single BI solution for analysis and decision-making to eliminate the issue with many reporting tools that was described above. However, once an organization is given a powerful, single BI solution and easy access to all important data through a data warehouse, a new problem often occurs: dozens if not hundreds of reports and dashboards are built by eager users, which easily results in “many versions of the truth” because business rules are defined differently by different users (there are ways to resolve this by the way, with a central key performance indicator (KPI) repository in the BI tool), and managers simple can’t find the right or the best dashboard or report anymore. This can be resolved by agreeing to corporate standard reports that are maintained by designated staff and flagged/organized separately from individual user-defined reports. It can also be nicely avoided by creating storyboards or playlists that have the best reports and dashboards in the best order of analysis. For example, starting with summary metrics and then going to detailed back-up information that users can use when needed.
Issue 4: Managers are not able to monitor their important metrics and quickly take action when there is an issue.
Solution: Create exception reports that are emailed to managers and that require online commentary when there is an exception. The reports should be very simple to read and focused on agreed-upon KPIs. While implementing a data warehouse to bring all data important for decision-making into a single data store solves the problem of having to use many report writers or having to manually combine data in Excel, it does not solve the question of
how the information is consumed by your decision-makers. Even if you achieved the ideal state of only using one report writer and one dashboard tool and they are completely integrated into the same easy-to-access web portal, you may still have a big problem that reduces the quality and speed of decisions. Let’s say a manager can do most of his or her analysis based on six or seven KPIs or metrics, but that these are spread across a profit & loss report, a sales report, an inventory report and a dashboard. Chances are that this manager will make sub-optimal decisions because the person will miss or forget information while hopping from one report to another. So the power of a simple KPI-based summary report that highlights important exceptions can be huge for world-class decision-making. Such a report should come with links, drill down to detailed transaction reports and dashboards with trend analysis, and so on, so that as soon as the manager finds a problem or an opportunity in the KPI report, he or she can quickly and easily navigate directly to the detailed information for further analysis. Two other key features on such a report should be the ability for the user to enter a comment on the pertinent line items, and the BI tool should also be able to be set up to automatically e-mail the report to the user if there is a flagged exception so that no time is lost in the decision-making process. The commentary serves several purposes, including reducing the need for the same person or other people to go back and repeat the same analysis just to derive the same conclusion. It also provides an ability to do “comment comparison” over time. In other words, if the same issue keeps arising multiple times or it is not resolved, analyzing the comments helps see if the manager’s analysis of the problem is correct or why his or her proposed solution actually did not work. To be continued: next week, this blog will cover the remaining common problem faced in reporting and analysis from an executive’s perspective.
Solver enables world-class decisions with
BI360,
a
leading web-based CPM suite
made up of budgeting, reporting, dashboards, and data warehousing, delivered through a web portal. Solver offers BI360 through cloud and on-premise deployment and is reinventing CPM with its next generation solution. BI360 empowers business users with modern features including innovative use of Excel in the model design process. If you’re interested in learning more,
our team is excited to hear about your organizational needs and goals
The vast majority of organizations have at least five or more reporting, query and analysis tools for their different data sources. Some are web-based, some use proprietary client-server interfaces, some are easy to use and others are very technical and require IT help to design and maintain; most of them require different training classes and have different security models. In other words, it is a mess! And this is still the situation almost everywhere, seriously hampering the opportunity for managers to use world-class decision-making simply because, even if all the required reports are available, which is rarely the case, data is spread across numerous tools, with different report formats, different skill requirements to use, different logins and different methods to access, etc. In many cases, the required reports are not available, but managers don’t know how to modify or create a new report, so it never gets done; users export or enter the data in manual Excel models, or they simply learn to live without that information. Now, if you have implemented a data warehouse to resolve the issue of data spread across many data sources, you have also enabled the opportunity to implement a single BI solution for analysis and decision-making to eliminate the issue with many reporting tools that was described above. However, once an organization is given a powerful, single BI solution and easy access to all important data through a data warehouse, a new problem often occurs: dozens if not hundreds of reports and dashboards are built by eager users, which easily results in “many versions of the truth” because business rules are defined differently by different users (there are ways to resolve this by the way, with a central key performance indicator (KPI) repository in the BI tool), and managers simple can’t find the right or the best dashboard or report anymore. This can be resolved by agreeing to corporate standard reports that are maintained by designated staff and flagged/organized separately from individual user-defined reports. It can also be nicely avoided by creating storyboards or playlists that have the best reports and dashboards in the best order of analysis. For example, starting with summary metrics and then going to detailed back-up information that users can use when needed.
Issue 4: Managers are not able to monitor their important metrics and quickly take action when there is an issue.
Solution: Create exception reports that are emailed to managers and that require online commentary when there is an exception. The reports should be very simple to read and focused on agreed-upon KPIs. While implementing a data warehouse to bring all data important for decision-making into a single data store solves the problem of having to use many report writers or having to manually combine data in Excel, it does not solve the question of
how the information is consumed by your decision-makers. Even if you achieved the ideal state of only using one report writer and one dashboard tool and they are completely integrated into the same easy-to-access web portal, you may still have a big problem that reduces the quality and speed of decisions. Let’s say a manager can do most of his or her analysis based on six or seven KPIs or metrics, but that these are spread across a profit & loss report, a sales report, an inventory report and a dashboard. Chances are that this manager will make sub-optimal decisions because the person will miss or forget information while hopping from one report to another. So the power of a simple KPI-based summary report that highlights important exceptions can be huge for world-class decision-making. Such a report should come with links, drill down to detailed transaction reports and dashboards with trend analysis, and so on, so that as soon as the manager finds a problem or an opportunity in the KPI report, he or she can quickly and easily navigate directly to the detailed information for further analysis. Two other key features on such a report should be the ability for the user to enter a comment on the pertinent line items, and the BI tool should also be able to be set up to automatically e-mail the report to the user if there is a flagged exception so that no time is lost in the decision-making process. The commentary serves several purposes, including reducing the need for the same person or other people to go back and repeat the same analysis just to derive the same conclusion. It also provides an ability to do “comment comparison” over time. In other words, if the same issue keeps arising multiple times or it is not resolved, analyzing the comments helps see if the manager’s analysis of the problem is correct or why his or her proposed solution actually did not work. To be continued: next week, this blog will cover the remaining common problem faced in reporting and analysis from an executive’s perspective.
Solver enables world-class decisions with
BI360,
a
leading web-based CPM suite
made up of budgeting, reporting, dashboards, and data warehousing, delivered through a web portal. Solver offers BI360 through cloud and on-premise deployment and is reinventing CPM with its next generation solution. BI360 empowers business users with modern features including innovative use of Excel in the model design process. If you’re interested in learning more,
our team is excited to hear about your organizational needs and goals
January 19, 2018
TAGS: ax, KPI, profitability analysis, CPM Software, consolidation software, financial consolidation software, corporate management software, max credit union, CPM Solution, Microsoft Dynamics NAV, corporate performance management software, financial reporting software, CPM Solutions, financial reporting, corporate performance management solutions, Cloud Financial Reporting, cloud cpm, financial consolidation, it budget software