
Acumatica and Power BI are both rapidly growing cloud software applications. Although these technologies can be used independently, customers are increasingly using them together as an integrated platform. As executives drive their accounting teams to migrate to a modern cloud ERP system like Acumatica, senior leaders are at the same time expecting to gain the ability to perform world-class analyses with their new ERP. For that reason, evaluation teams not only have to review core ERP functionality to make sure current and future needs are met, but they also must determine the tools to use for dashboards, reporting, and planning. Power BI has become the world’s top business intelligence (BI) solution and is the natural data visualization dashboard choice for Acumatica. It is typically deployed as a stand-alone web service from Microsoft and often includes all kinds of non-financial data as well. As with any flexible dashboard software, however, developing Power BI models can be complex, time-consuming and costly, especially when building numerous dashboards and then tailoring them to your Acumatica business dimensions. And, if the Power BI models are not built wisely it can be a daunting task to maintain them when your chart of accounts grows and when you make other changes and additions in Acumatica. Most people that have implemented dashboard models for financial data know that it can take hundreds of hours of integration and design time before managers can enjoy their “shiny” dashboard gadgets. This blog will focus on
rapid deployment of Power BI dashboards for Acumatica, as well as several factors you may want to think about to ensure your executives’ expectations are met or exceeded when it comes to providing them with:
 Many Acumatica customers support graphical analysis needs through Excel because the software is already owned, users already know how to use it, and the interface is easy and flexible to build while maintaining the underlying formulas. However, there is a rapidly growing demand for cloud-based, best-of-breed dashboard tools like Power BI that offer a dynamic and secure user experience with rich, interactive charting and drill-down that provides real-time, self-service
reporting and analysis processes.
How to Pick the Right Dashboard Solution for Acumatica Much can be written about the best and most affordable way to deploy Power BI. Most organizations find that delivering a rich and sustainable dashboard experience to their business and office of finance users does require more than just a Power BI license. These other components include:
Many Acumatica customers support graphical analysis needs through Excel because the software is already owned, users already know how to use it, and the interface is easy and flexible to build while maintaining the underlying formulas. However, there is a rapidly growing demand for cloud-based, best-of-breed dashboard tools like Power BI that offer a dynamic and secure user experience with rich, interactive charting and drill-down that provides real-time, self-service
reporting and analysis processes.
How to Pick the Right Dashboard Solution for Acumatica Much can be written about the best and most affordable way to deploy Power BI. Most organizations find that delivering a rich and sustainable dashboard experience to their business and office of finance users does require more than just a Power BI license. These other components include:
 In other words, with true marketplace templates, you should be able to provide your managers with professional dashboards and reports
the same day you install the reporting tool--and with no upfront formula design or Power BI model building! Now that’s a quick deployment!
Summary For new or existing Acumatica customers, the 2020s hold a lot of promise. Acumatica is continuously improving and updating their ERP system, while a rapidly growing Marketplace of third-party apps further enhances the benefits of Acumatica. Picking the right solutions, like data visualization tools for dashboards as an example, can significantly improve your processes, save you time, and help drive faster and better decisions by putting the right information in front of your managers and executives when and where they need it.
In other words, with true marketplace templates, you should be able to provide your managers with professional dashboards and reports
the same day you install the reporting tool--and with no upfront formula design or Power BI model building! Now that’s a quick deployment!
Summary For new or existing Acumatica customers, the 2020s hold a lot of promise. Acumatica is continuously improving and updating their ERP system, while a rapidly growing Marketplace of third-party apps further enhances the benefits of Acumatica. Picking the right solutions, like data visualization tools for dashboards as an example, can significantly improve your processes, save you time, and help drive faster and better decisions by putting the right information in front of your managers and executives when and where they need it.
- Revenue Dashboards
- Expense Dashboards
- Variance Dashboards
- Exception Dashboards
- Trend Dashboards
- Balance Sheet Dashboards
- KPI Dashboards
- Benchmarking Dashboards
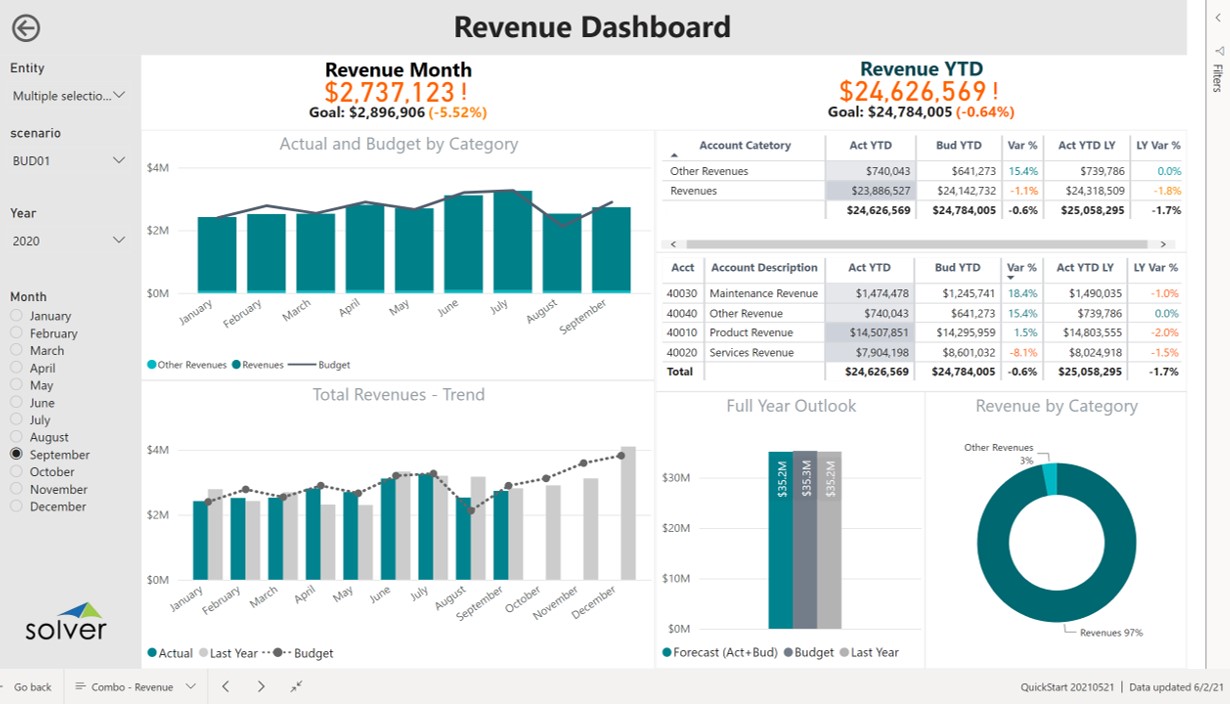
Solver QuickStart Dashboard Example
- Pre-built financial dashboard templates that work out-of-the box, and that can be changed or copied to support special custom needs.
- Financial reporting and planning that complement Power BI graphical dashboards. Here is more information about things to look for in professional reporting and planning
- A data warehouse or staging database to organize key Acumatica data and dimensions, with the added capability to include non-ERP data in order to deliver a comprehensive, clean data model to Power BI. Read more about pre-built financial data warehouses here.
- Usually gets you there: Generic integration tools that require a lot of skills and time to configure.
- Works but often with limitations: Connectors specifically built for Acumatica, but do not include an app that configures dimensions and views in Acumatica nor pre-maps to popular fields to “light them up” for its API.
- Quickest and easiest: Connectors specifically built for Acumatica that include an app or script(s) that properly and automatically configure dimensions and views in Acumatica and expose them to its API. This results in a “clean” data model that Power BI can easily consume. You can see an example of this type of integration here.
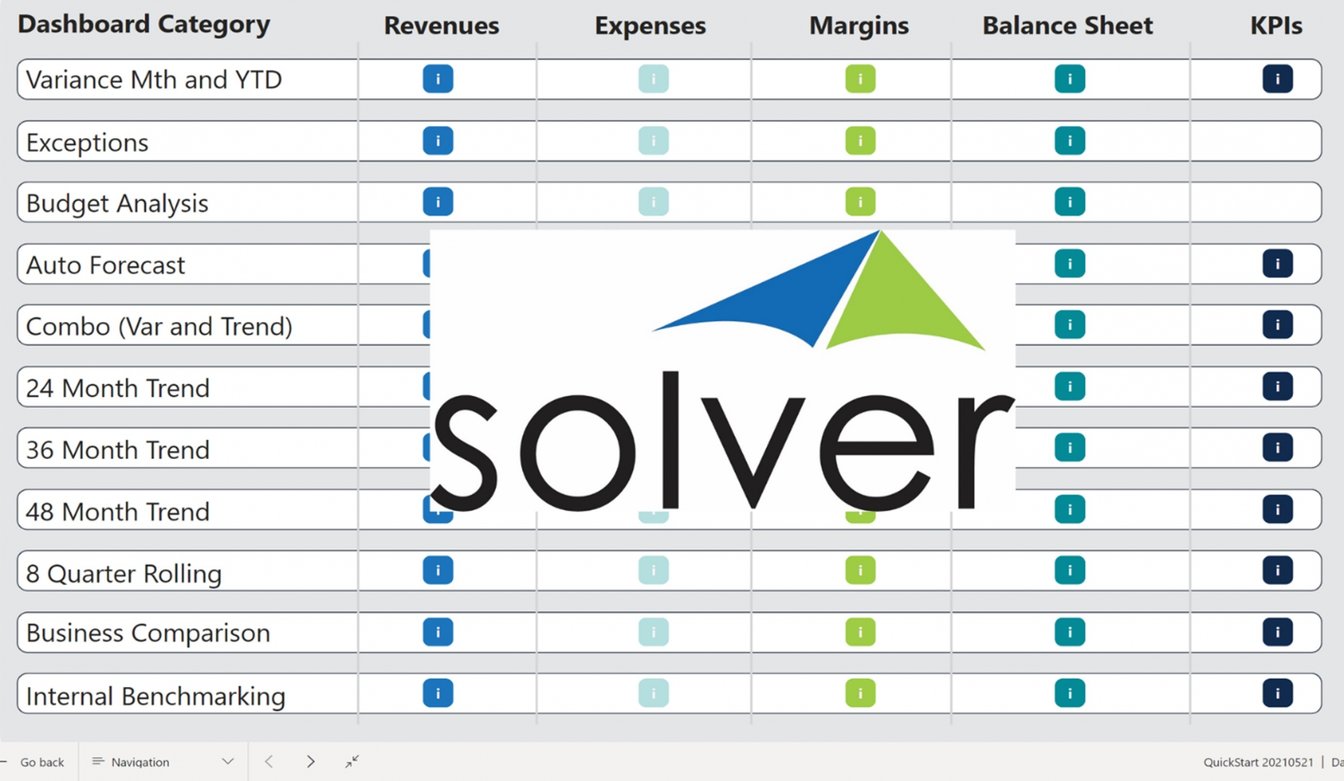
Solver QuickStart Financial Dashboard Categories for Acumatica
October 2, 2021
TAGS: Reporting, Solver, Microsoft, Acumatica, planning, QuickStart, excel, roi, forecasting, budgeting, dashboard templates, KPI, Tableau, BI, CPM, Power BI, EPM, ERP, Corporate Performance Management, reporting tools, financial statements, API, Excel reporting, Acumatica reporting, Acumatica dashboards, best dashboard tools for Acumatica, pre-built dashboards, integration, business intelligence, financial reporting, fulfilled by acumatica, Power BI dashboards, Dashboards